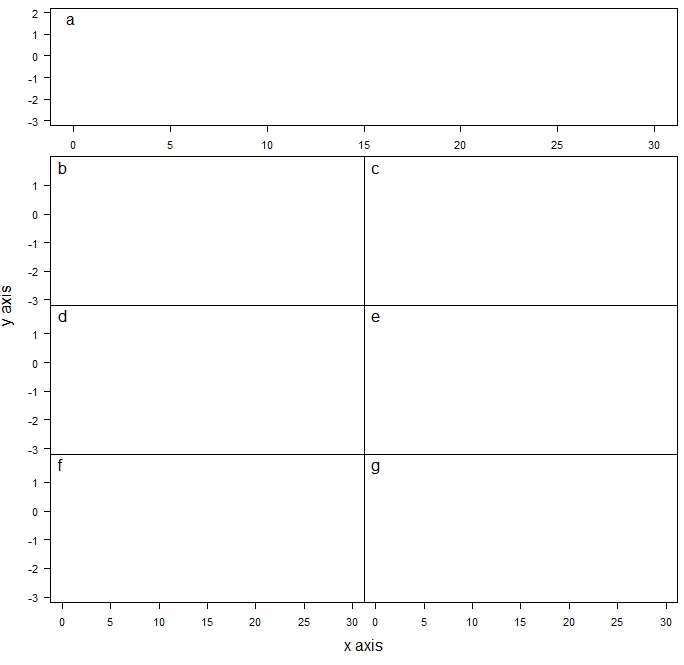
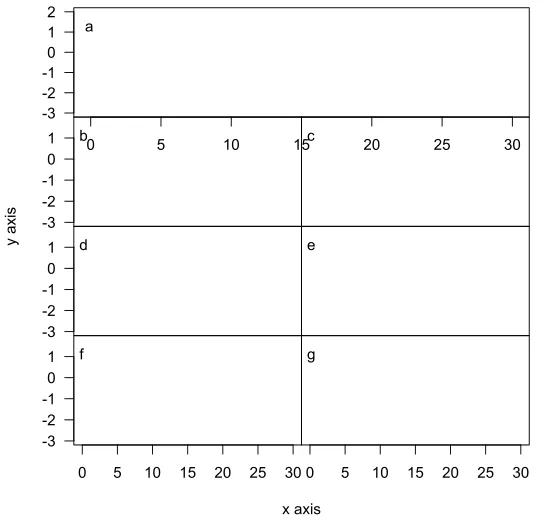
我有一个由7个图形组成的布局,其中一个在顶部,其他6个分别在第一个下面以3x2矩阵展开。在我的布局中,这些图形是完全在一起的,我想在第一个图形和其他图形之间留下一点空隙。我如何在R中实现这个?
layout(matrix(c(1,1,2,3,4,5,6,7), 4, 2, byrow = T))

par(mar = c(0,0,0,0), oma = c(5,4,0.5,0.5), las =1)


plot(1:10, axes = T, type = "n", xlim = c(0,30), ylim = c(-3,2), las =1)
mtext(letters[1], side = 3, line = -1.5, adj = 0.025)

for (i in 2:7){
  plot(1:10, axes = F, type = "n", xlim = c(0,30), ylim = c(-3,1.8))
  mtext(letters[i], side = 3, line = -1.5, adj = 0.025)

  if (i %in% c(6,7))
    axis(side = 1)

  if (i %in% c(2,4,6))
    axis(side = 2)
  box()
}
mtext("x axis", side = 1, outer = TRUE, line = 3)
mtext("y axis", side = 2, outer = TRUE, line = 3, las = 3)
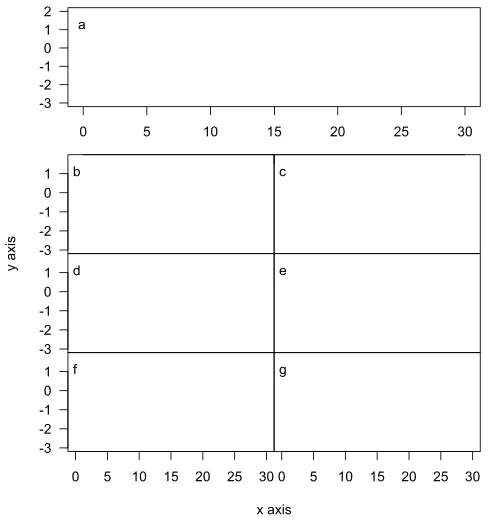
我想要类似的东西