你可以通过以下几种方式区分曲线:
-1- 数据倾斜
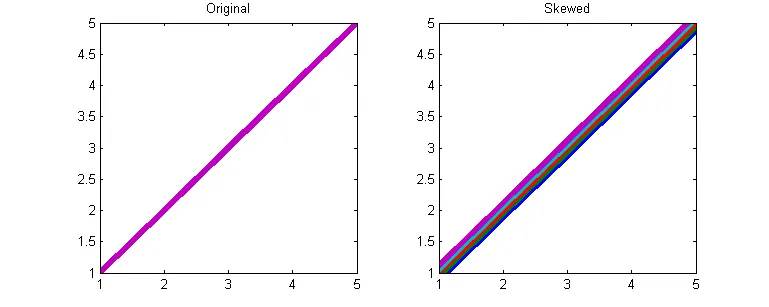
就像你说的那样,你可以稍微移动一下数据。我建议你固定坐标轴,然后计算每个线宽有多少单位,这样你就可以得到非常紧密的拟合效果,像这样:
lineWidth = 5;

figure(33);
clf;
subplot(1,2,1);
h = plot(myData, 'linewidth', lineWidth);
xlim([1,5]);
ylim([1,5]);
title('Original');

myData = meshgrid(1:5)';

myLimDiff = diff(ylim);
set(gca,'units', 'pixels');
myPos = get(gca, 'position')
myWidthHeight= myPos(3:4)

PixelsPerUnit =myWidthHeight(2)./ myLimDiff;
myDataSkewed = myData + meshgrid(-2:2)*1/PixelsPerUnit(1)*lineWidth;

subplot(1,2,2);
plot(myDataSkewed, 'linewidth', lineWidth);
xlim([1,5]);
ylim([1,5]);
title('Skewed');
结果:
-2- 使用实线和虚线
正如其他评论中提到的,您可以在实线上使用虚线,或者使用一些组合样式。
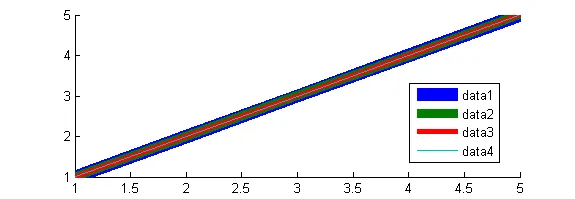
-3- 使用不同的线条粗细
使用不同的线宽,最厚的放在底部:
figure(54);
clf
hold all
for ind = 10:-3:1
    plot(1:5, 'linewidth', ind);
end
-4- 使用带有变化的单独图表来显示每条线
另一种逐行绘制的方法是将每行绘制在一个子图中,但首先以灰色绘制所有数据。这样您可以看到所有线条的位置,并呈现特定线条:
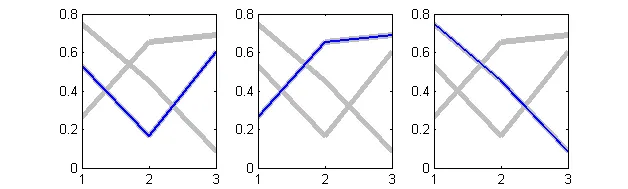
figure(55);
clf
data = rand(3);

for ind = 1:3
    subplot(1,3,ind);
    plot(data, 'linewidth', 4, 'color', [1 1 1]*.75);
    hold on
    plot(data(:,ind), 'linewidth', 2);
end
'--o'这样的线型,这些线型会使底层线条可见。 - Deveplot3绘制图形,并为每个图形设置不同的 z 值。然后将视角设置为适当的值。 - Itamar Katz--r表示一行,使用-b表示另一行,例如。然后你会看到蓝线下面有红线。当然,这仅适用于有限数量的行。 - Deve