今天我尝试从我的分类模型绘制混淆矩阵。在查看了一些页面后,我发现
pyplot中的matshow可以帮助我。import matplotlib.pyplot as plt
from sklearn.metrics import confusion_matrix
def plot_confusion_matrix(cm, title='Confusion matrix', cmap=plt.cm.Blues, labels=None):
fig = plt.figure()
ax = fig.add_subplot(111)
cax = ax.matshow(cm)
plt.title(title)
fig.colorbar(cax)
if labels:
ax.set_xticklabels([''] + labels)
ax.set_yticklabels([''] + labels)
plt.xlabel('Predicted')
plt.ylabel('True')
plt.show()
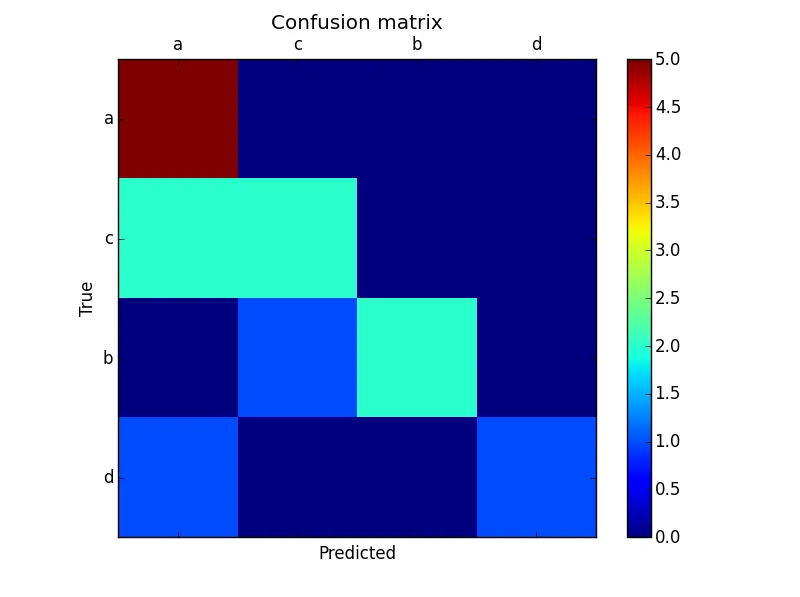
如果我只有很少的标签,它就能很好地工作
y_true = ['a', 'b', 'c', 'd', 'a', 'b', 'c', 'a', 'c', 'd', 'b', 'a', 'b', 'a']
y_pred = ['a', 'b', 'c', 'd', 'a', 'b', 'b', 'a', 'c', 'a', 'a', 'a', 'a', 'a']
labels = list(set(y_true))
cm = confusion_matrix(y_true, y_pred)
plot_confusion_matrix(cm, labels=labels)
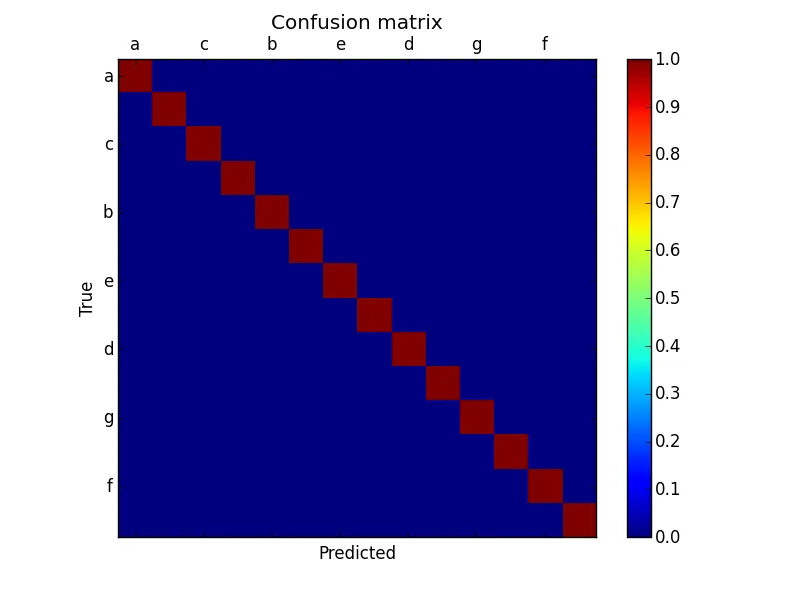
但是如果我有很多标签,有些标签就无法正确显示。
y_true = ['a', 'b', 'c', 'd', 'e', 'f', 'g', 'h', 'i', 'j', 'k', 'l', 'm', 'n']
y_pred = ['a', 'b', 'c', 'd', 'e', 'f', 'g', 'h', 'i', 'j', 'k', 'l', 'm', 'n']
labels = list(set(y_true))
cm = confusion_matrix(y_true, y_pred)
plot_confusion_matrix(cm, labels=labels)
fontdict的东西,但它仍然无法正常工作。
ax.xaxis.set_major_locator后面加上ax.matshow(data, cmap=plt.cm.Blues, alpha=0.7)时,它没有起作用;这只是给其他人的一个提示。 - Alex Punnen