以下是我使用SGD实现的线性回归,但得到的直线并不是最佳拟合线。我该如何改进呢?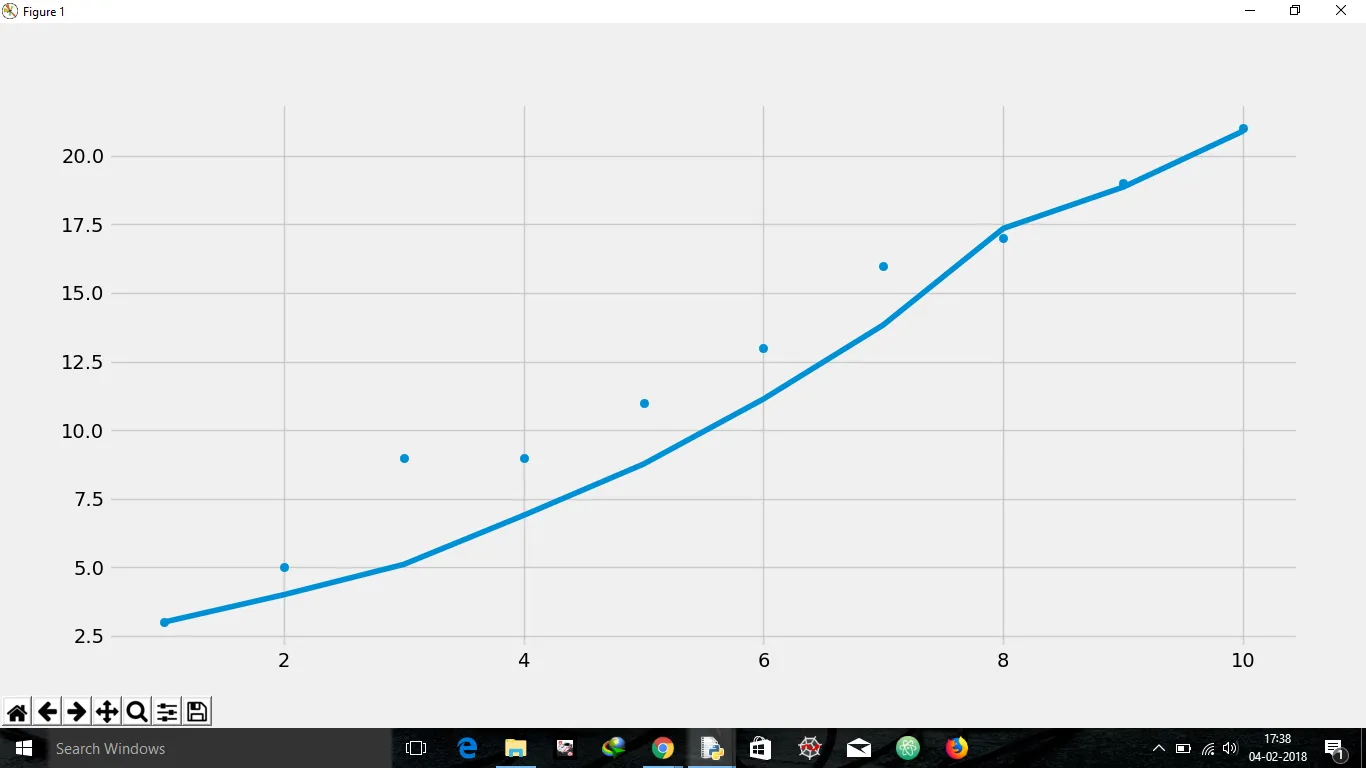
import matplotlib.pyplot as plt
from matplotlib import style
import numpy as np
style.use("fivethirtyeight")
x=[[1],[2],[3],[4],[5],[6],[7],[8],[9],[10]]
y=[[3],[5],[9],[9],[11],[13],[16],[17],[19],[21]]
X=np.array(x)
Y=np.array(y)
learning_rate=0.015
m=1
c=2
gues=[]
for i in range(len(x)):
guess=m*x[i][0]+c
error=guess-y[i][0]
if error<0:
m=m+abs(error)*x[i][0]*learning_rate
c=c+abs(error)*learning_rate
if error>0:
m=m-abs(error)*x[i][0]*learning_rate
c=c-abs(error)*learning_rate
gues.append([guess])
t=np.array(gues)
plt.scatter(X,Y)
plt.plot(X,t)
plt.show()
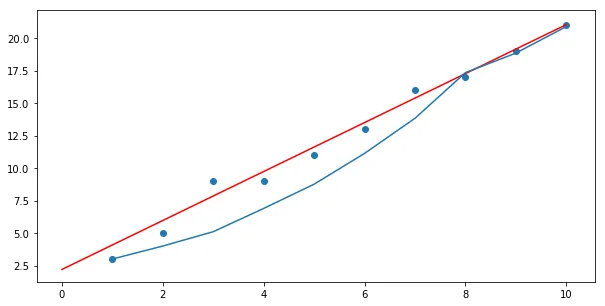
from sklearn.linear_model import LinearRegression
var=LinearRegression()
var.fit(X,Y)
plt.scatter(X,Y)
plt.plot(X,var.predict(X))
plt.show()
由于我必须最小化误差,即对误差函数关于m的偏导数产生(猜测-y),关于x和关于c的偏导数给出一个常数。
m和c是你的最终参数,而不是gues。 - Matt Hall