我制作了这个火山图并希望进行以下改进:
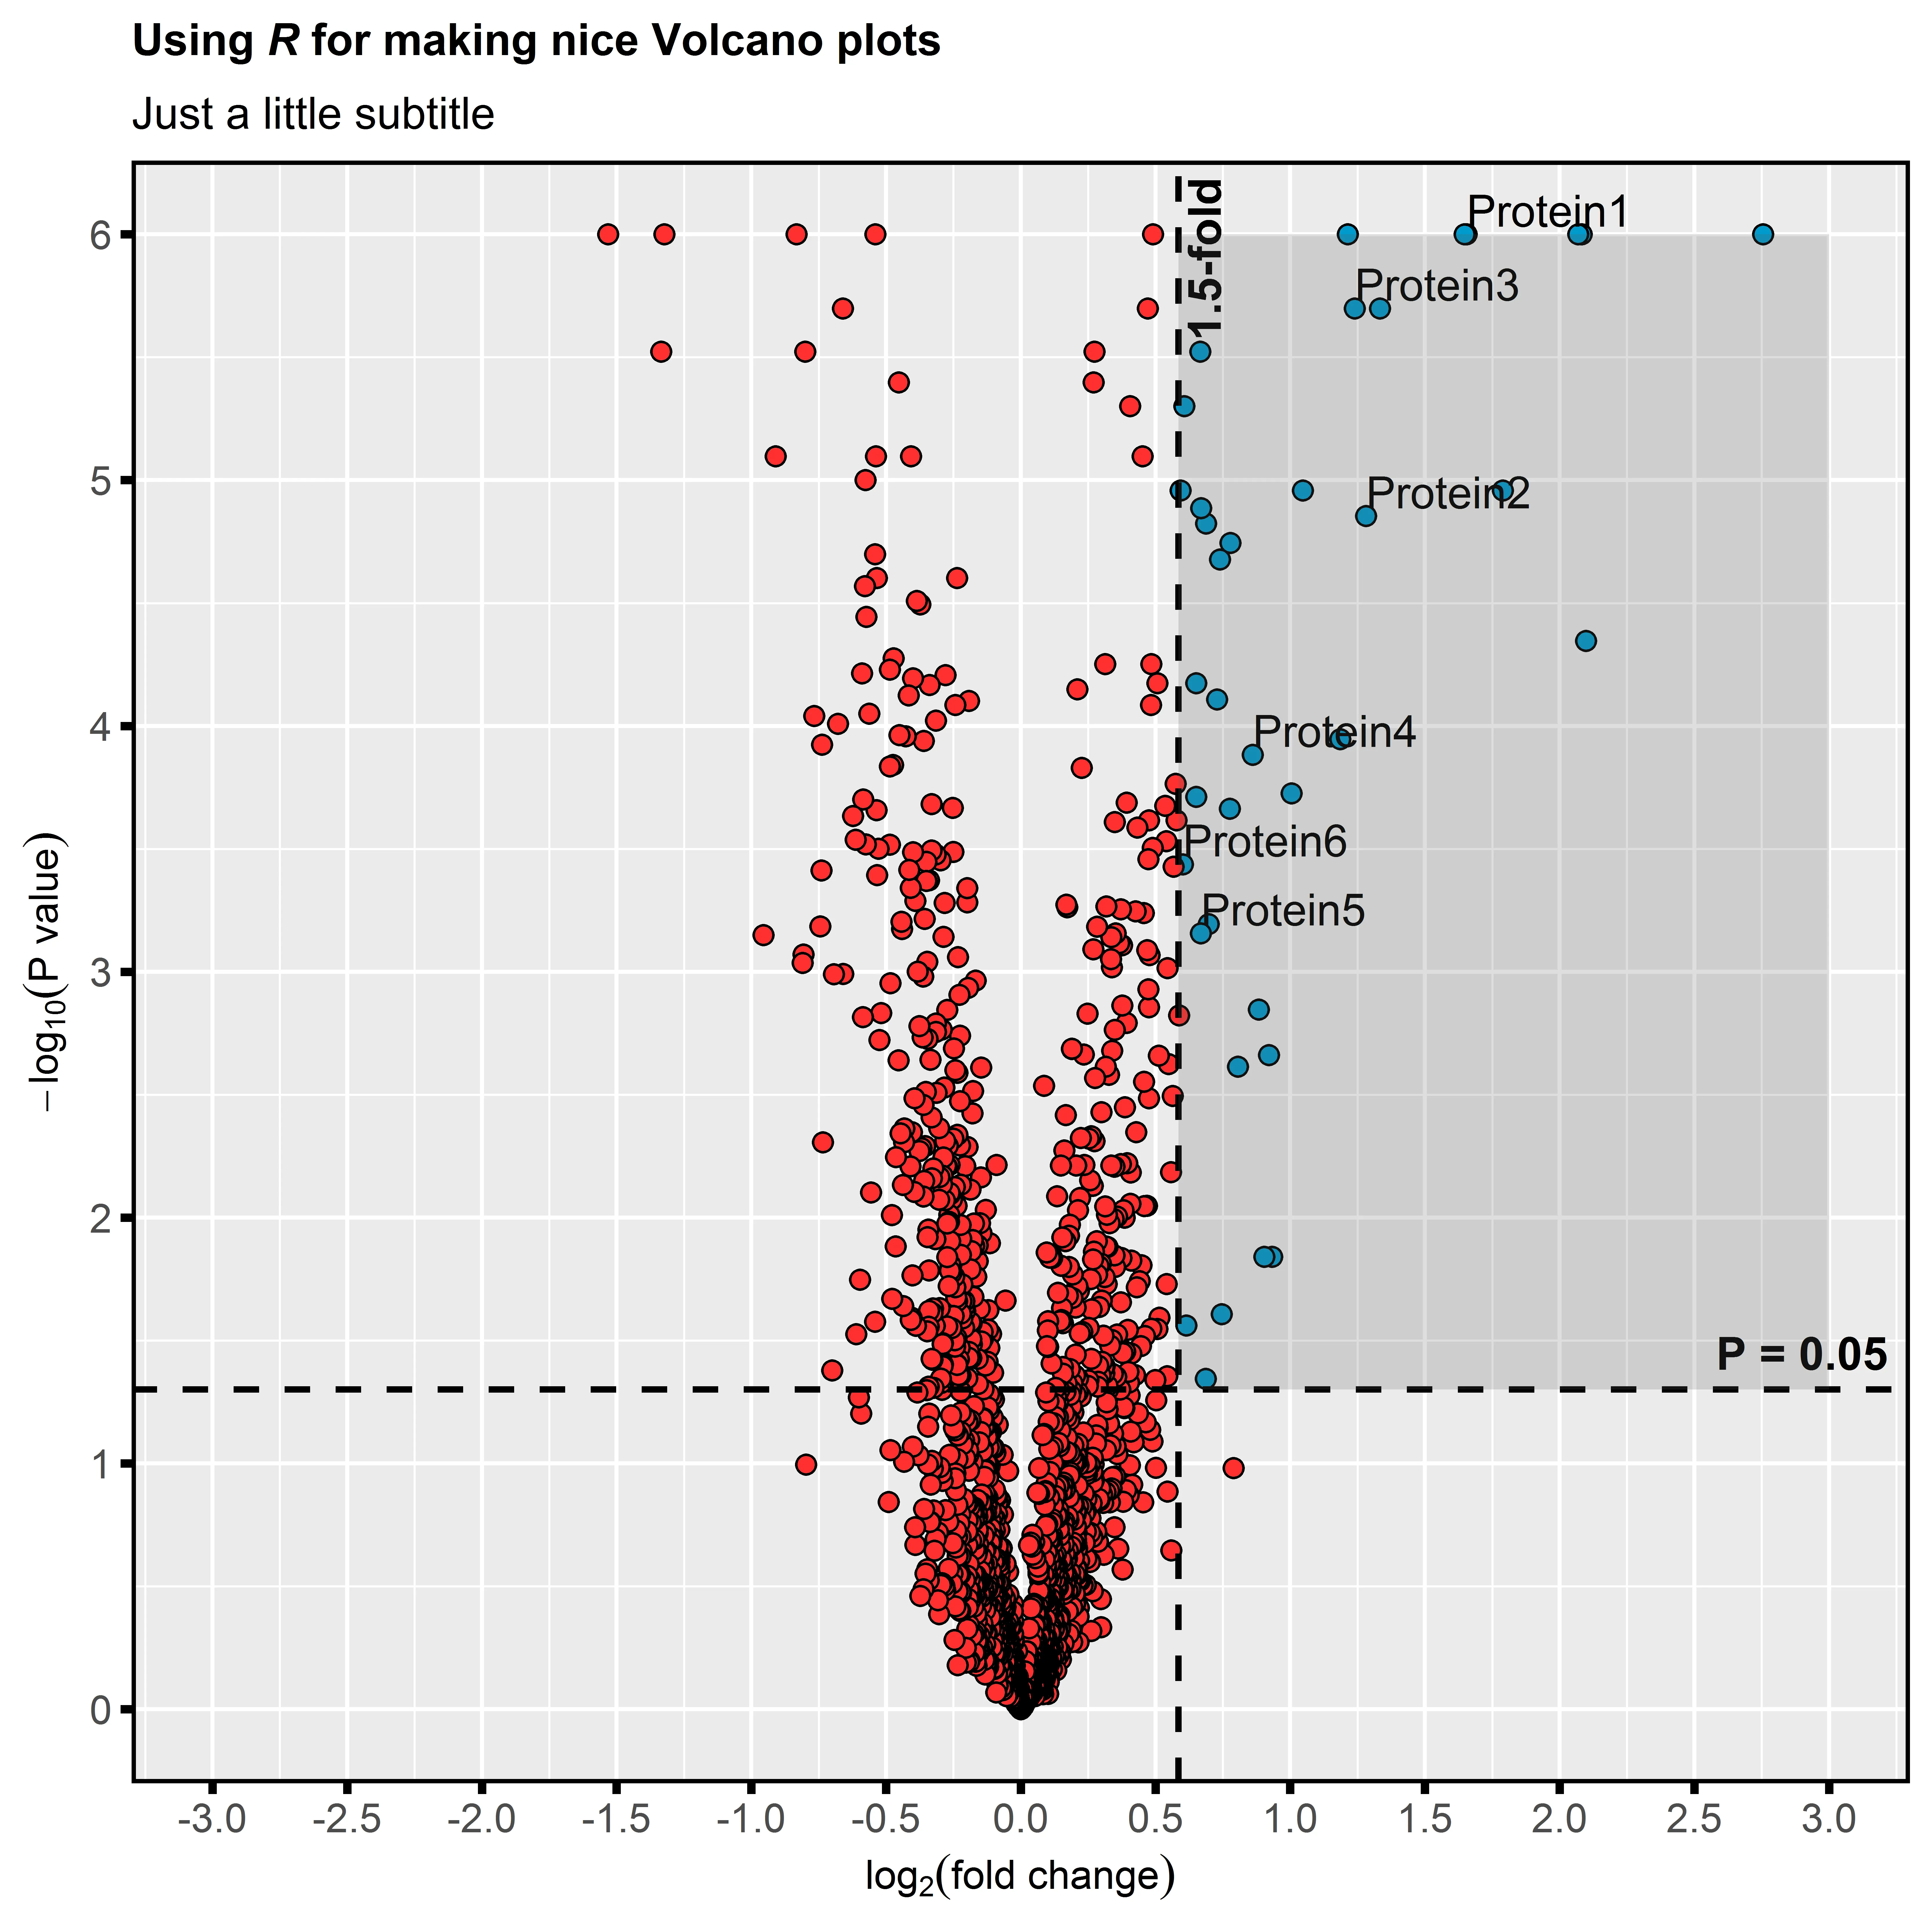
- 完全用蓝色数据点填充该区域:使用当前代码,我无法将阴影延伸到超出现有范围。我希望它能够覆盖整个绘图区域。
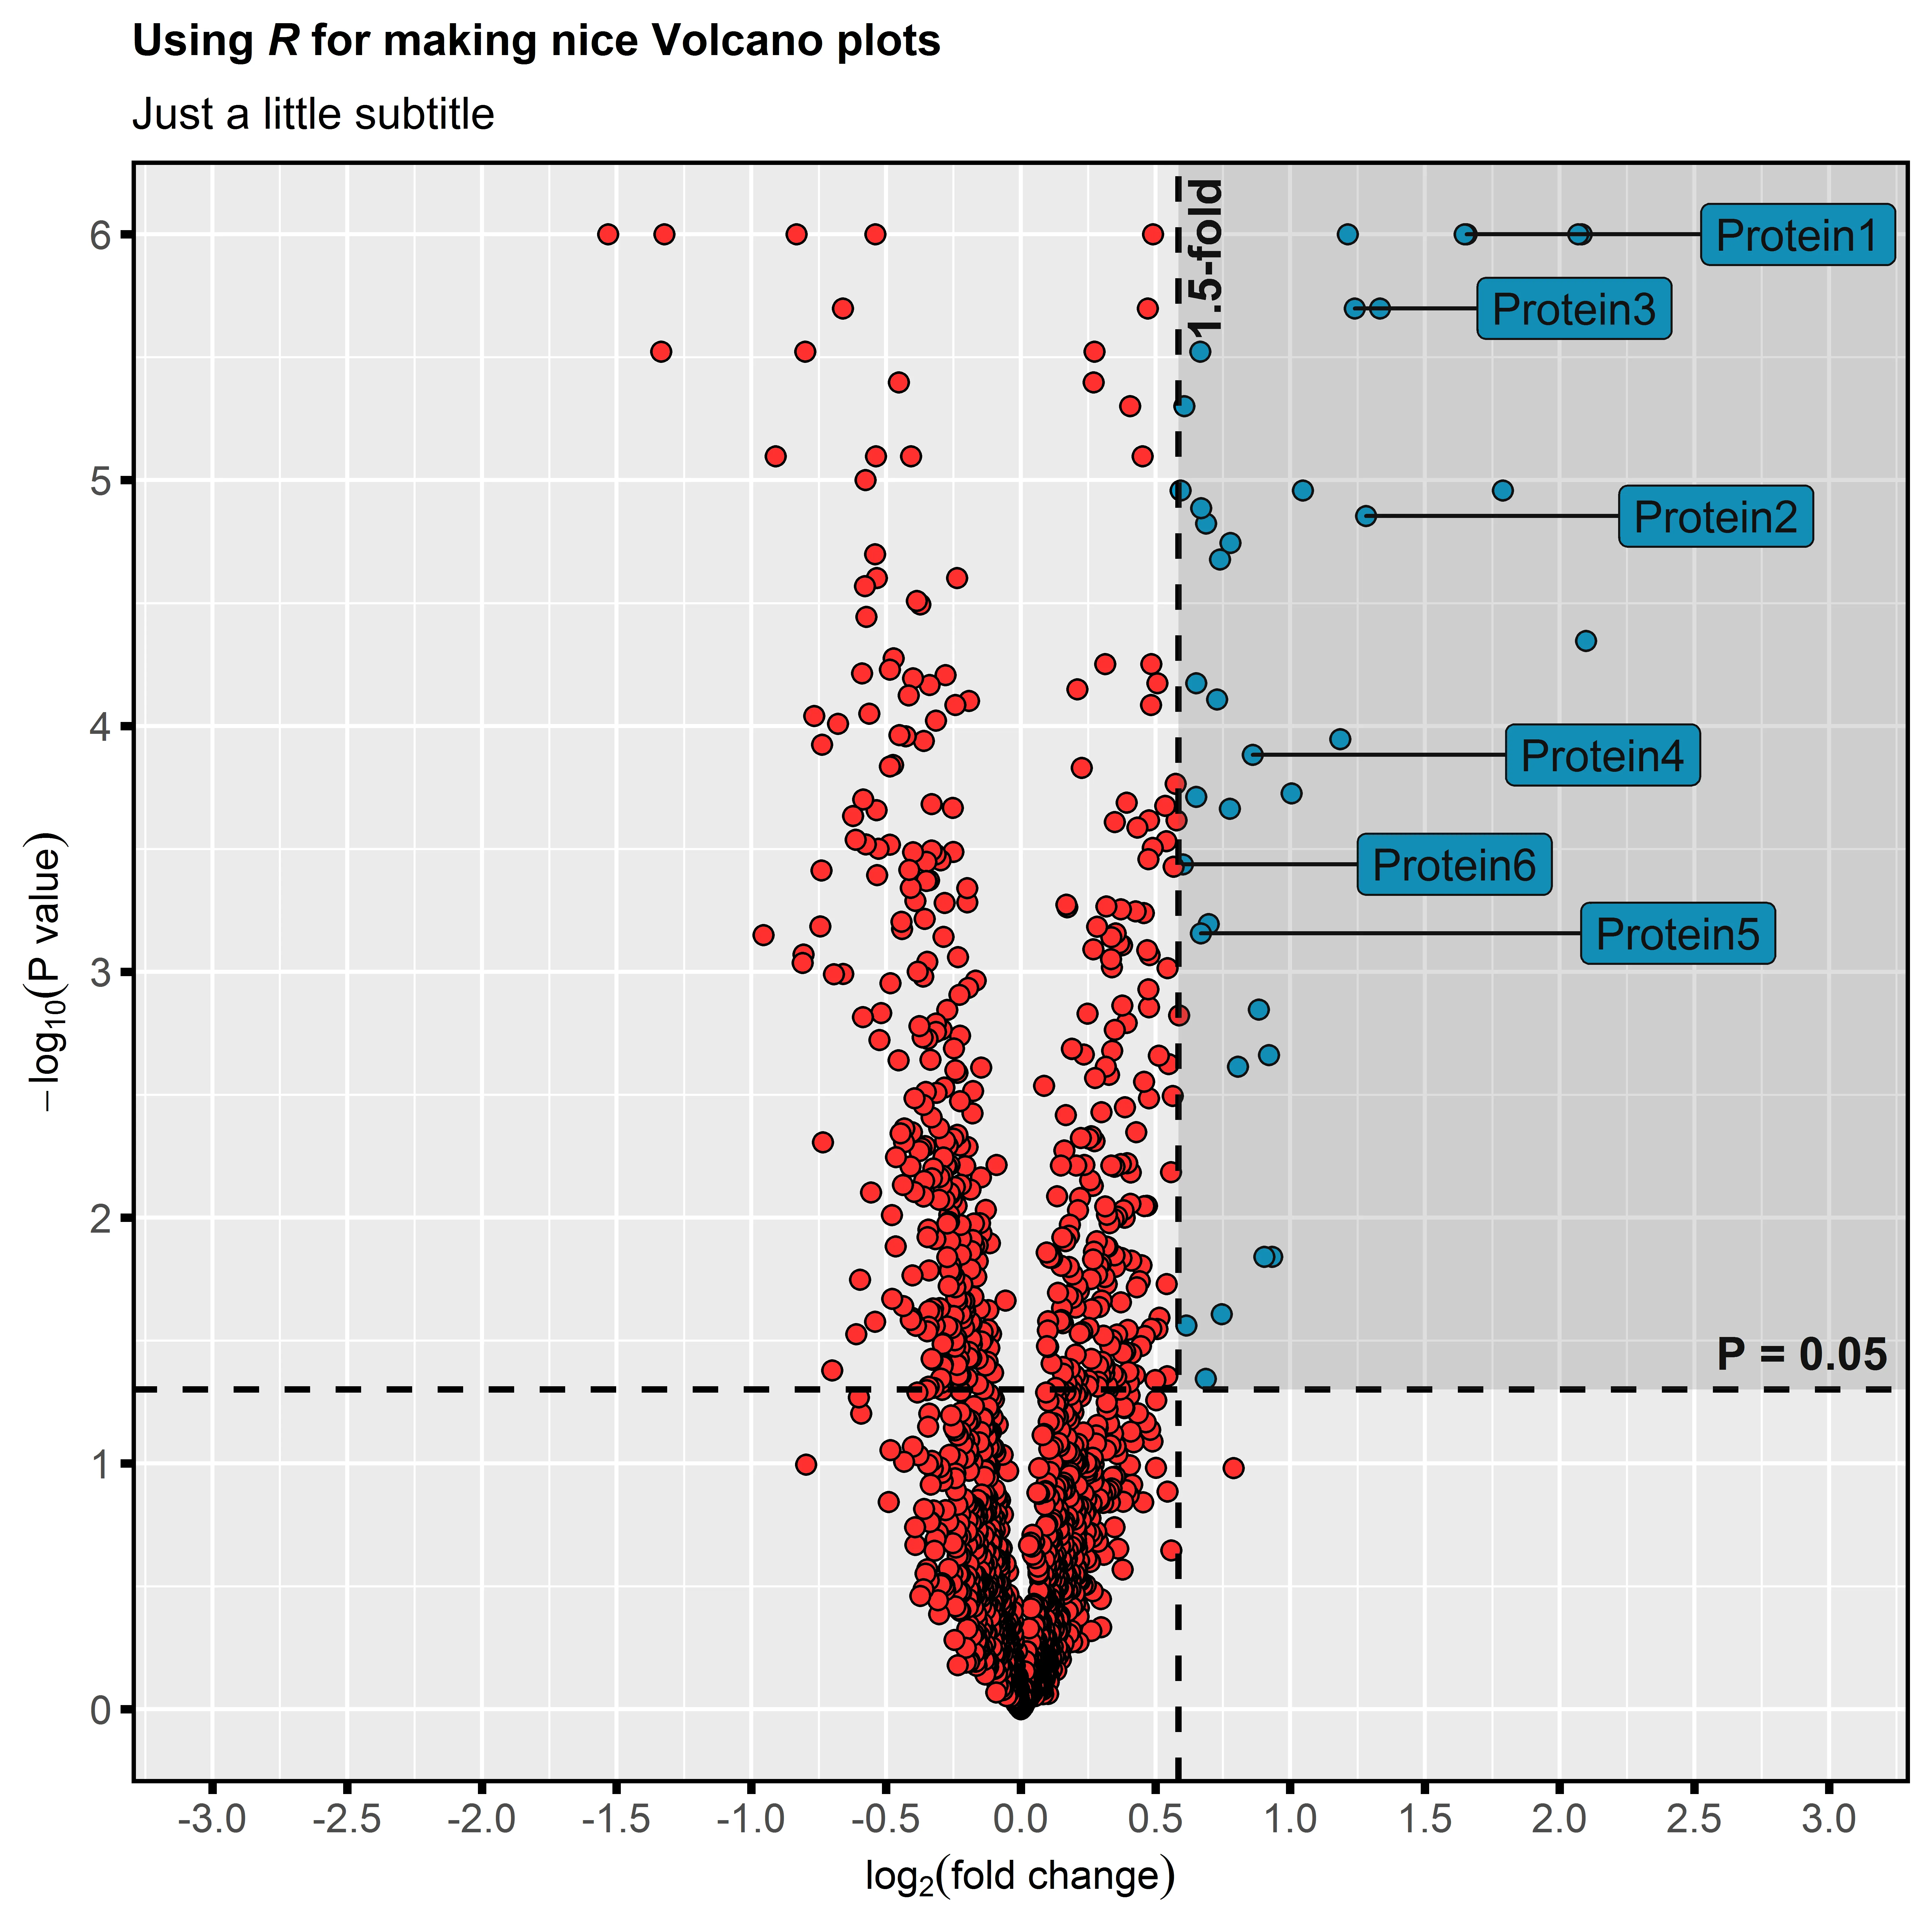
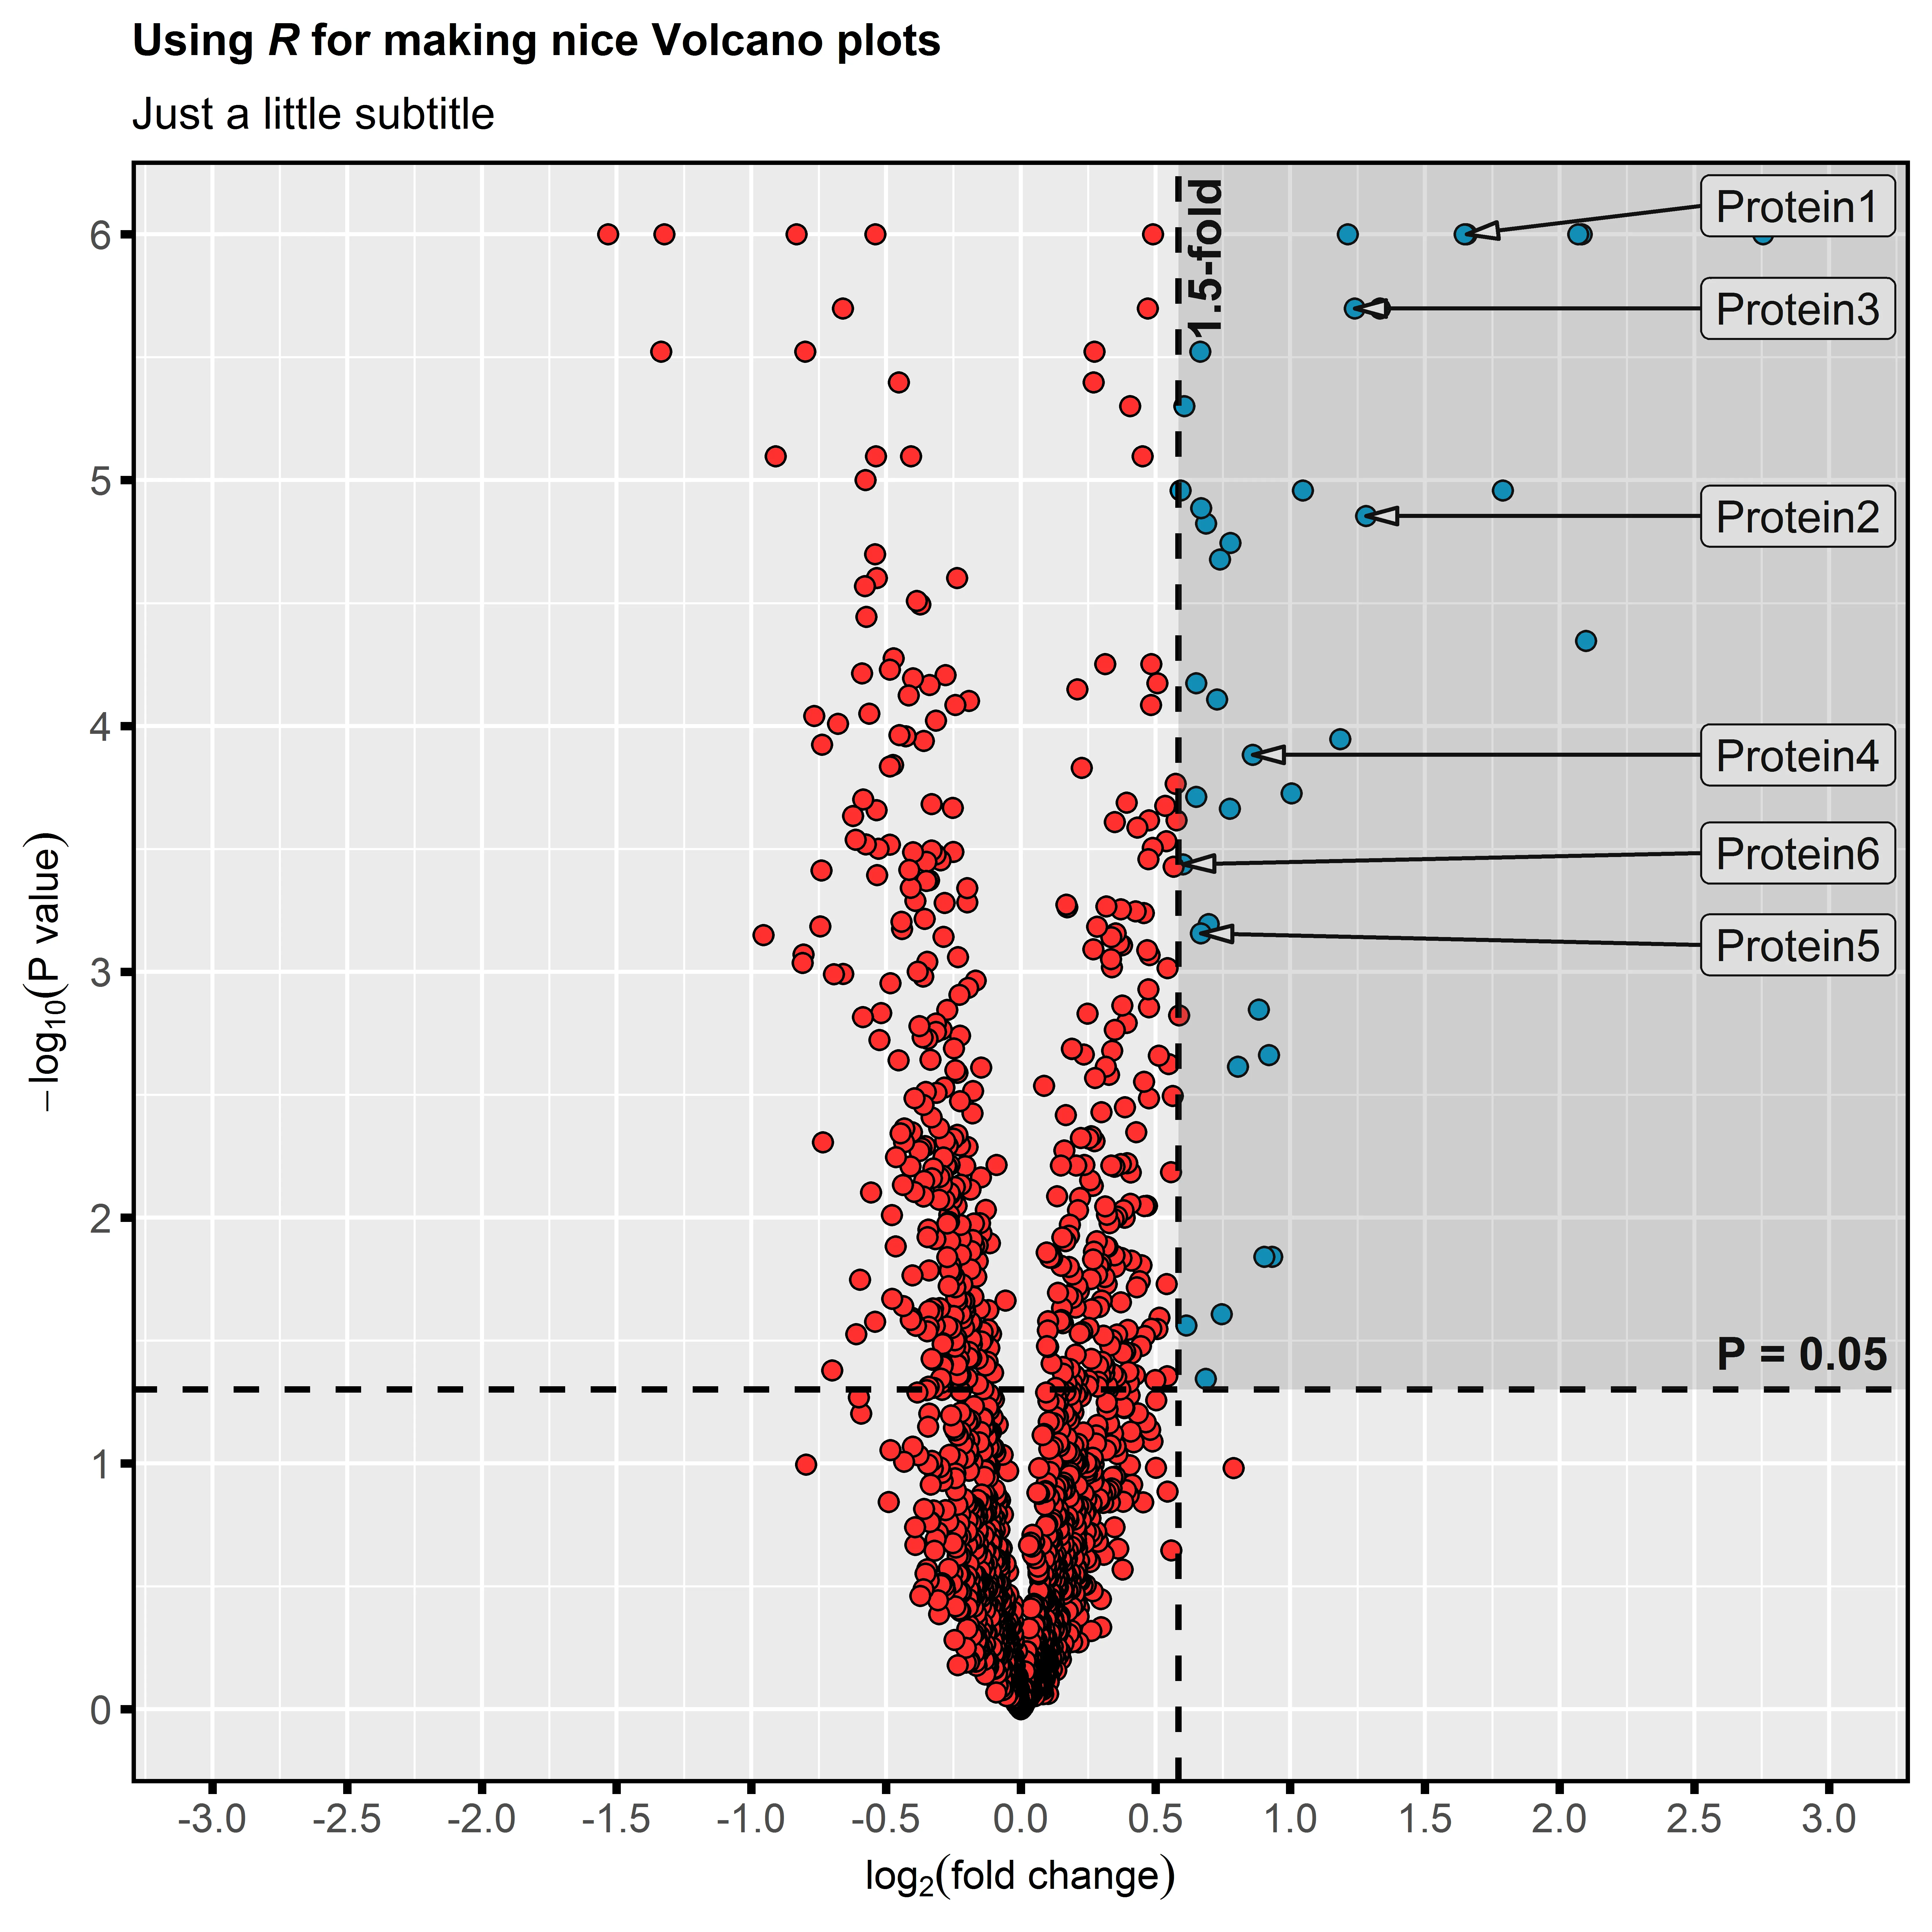
geom_text允许我标记数据点的子集,但使用ggrepel可以添加连接数据点和标签的线条,从而提高标签清晰度。如何重用ggrepel中已有的geom_text代码来实现这一点?
ggplot(vol.new, aes(x = log2.fold.change, y = X.NAME., fill = Color)) + # Define data frame to be used for plotting; define data for x and y axes; crate a scatterplot object.

  geom_point(size = 2, shape = 21, colour = "black") + # Define data point style.

  ggtitle(main.title, subtitle = "Just a little subtitle") + # Define title and subtitle.

  labs(x = x.lab, y = y.lab) + # Define labels for x and y axes.

  scale_x_continuous(limits = c(-3, 3), breaks = seq(-3, 3, by = 0.5)) + # Define x limits, add ticks.
  scale_y_continuous(limits = c(0, 6), breaks = seq(0, 6, by = 1)) + # Define y limits, add ticks.

  theme(
    plot.title = element_text(family = "Arial", size = 11, hjust = 0), # Title size and font.
    plot.subtitle = element_text(family = "Arial", size = 11), # Subtitle size and font.
    axis.text = element_text(family = "Arial", size = 10), # Size and font of x and y values.
    axis.title = element_text(family = "Arial", size = 10), # Size and font of x and y axes.
    panel.border = element_rect(colour = "black", fill = NA, size = 1), # Black border around the plot area.
    axis.ticks = element_line(colour = "black", size = 1), # Style of x and y ticks.
    legend.position = "none"
  ) + # Remove legend.

  geom_hline(yintercept = 1.30103, colour = "black", linetype = "dashed", size = 0.75) + # Horizontal significance cut-off line.
  geom_vline(xintercept = 0.584963, colour = "black", linetype = "dashed", size = 0.75) + # Vertical significance cut-off line (+).
  # geom_vline (xintercept = -0.584963, colour = "black", linetype = "dashed", size = 0.75) #Vertical significance cut-off line (-)

  scale_fill_manual(breaks = c("blue", "red"), values = c("deepskyblue3", "firebrick1")) + # Costum colors of data points based on "PursFur" column.

  geom_text(aes(label = ifelse(PursFur == 1, as.character(Protein.ID), "")), hjust = 0, vjust = -0.25) + # Add identifiers to a subset of data points.

  annotate("text", x = 2.9, y = 1.45, label = "P = 0.05", size = 4, fontface = "bold") + # Label to horizontal cut-off line.
  annotate("text", x = 0.68, y = 5.9, label = "1.5-fold", size = 4, fontface = "bold", srt = 90) + # Label to vertical cut-off line.
  annotate("rect", xmin = 0.584963, xmax = 3, ymin = 1.30103, ymax = 6, alpha = .2) # Shade plot subregion.