我正在尝试构建一个GUI来帮助我的团队快速比较大量的测试数据,这些数据以信号形式呈现。 我设想采用高度模块化、交互式绘图,格式类似于Audacity。 我正在使用PyQt5构建GUI,并目前正在决定用什么来绘制图表;我原计划使用matplotlib,但对于预期使用来说它将非常笨重。 Plotly和/或Dash似乎更有前途;然而,它们只在浏览器中显示交互式图表,因此我需要使用某种浏览器显示嵌入到GUI中。因此,我选择了QWebEngineView。
我的GUI本身将在QTabWidget中的选项卡中容纳图表,我已经开发了这个功能,而其他选项卡则填充了占位符matplotlib图表,我想要替换它们,因为它们缺乏易于交互的功能。我成功地在浏览器中显示了网页(google.com)。
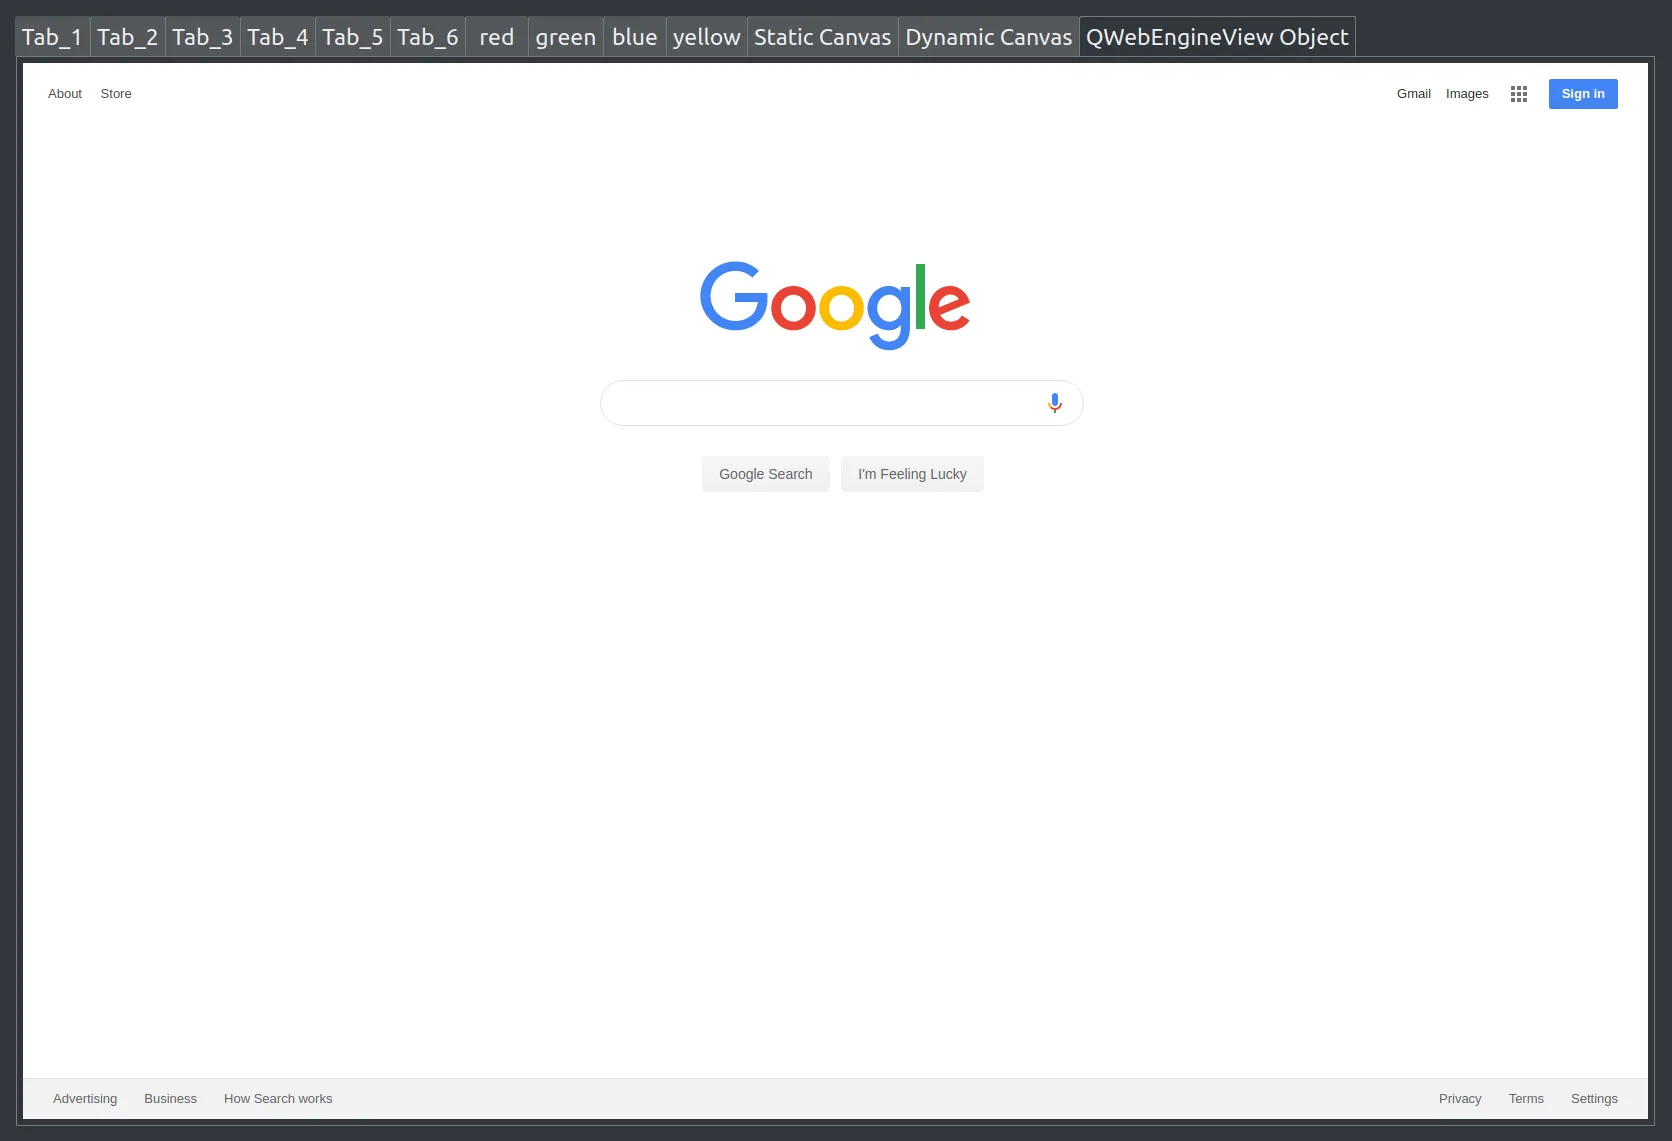
在PyQt5 GUI中的QTabWidget对象中的QWebEngineView对象中成功显示网页。
Dash Plot未显示。
这只发生在 QTabsWidget 中。Dash 绘图在单独的独立应用程序中可以正常显示(下面提供了作为占位符 Dash 绘图的工作代码)。
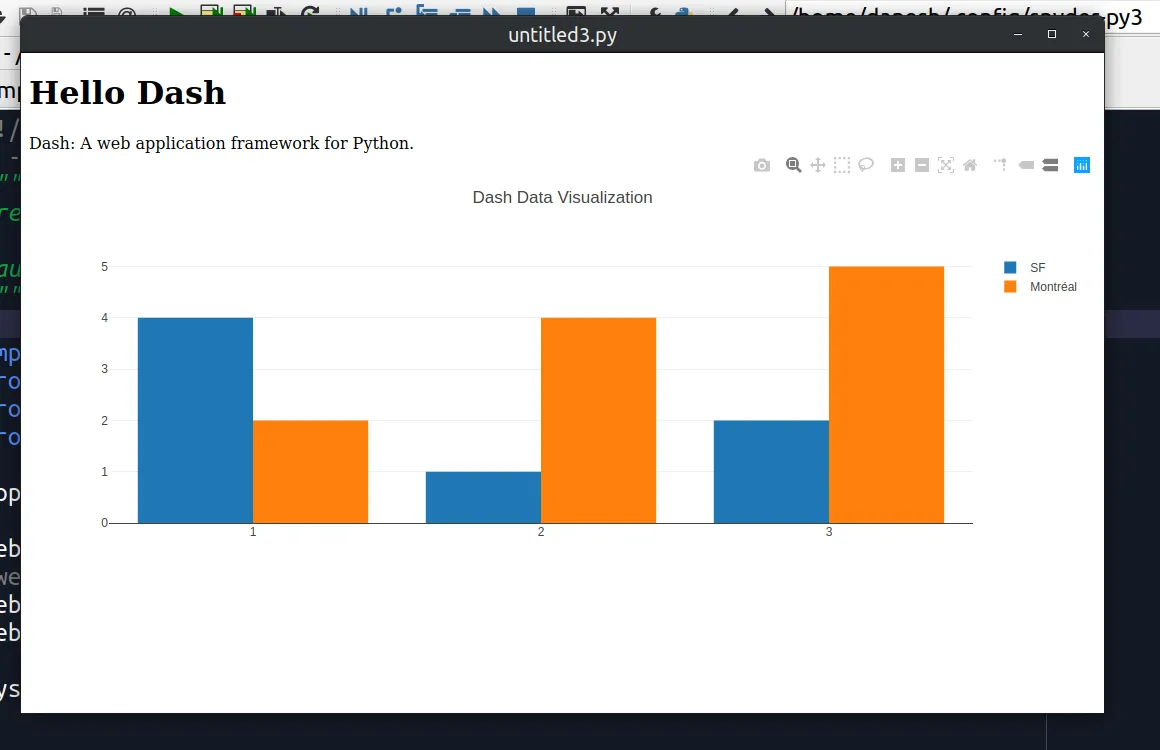
Dash 绘图在简单的 PyQt5 GUI 中成功显示。
Dash Plot Working Code:
运行此代码后,内核提供绘图的地址。在我的机器上,它是http://127.0.0.1:8050。
GUI嵌入式代码原型:
我的GUI本身将在QTabWidget中的选项卡中容纳图表,我已经开发了这个功能,而其他选项卡则填充了占位符matplotlib图表,我想要替换它们,因为它们缺乏易于交互的功能。我成功地在浏览器中显示了网页(google.com)。
在PyQt5 GUI中的QTabWidget对象中的QWebEngineView对象中成功显示网页。
Dash Plot未显示。
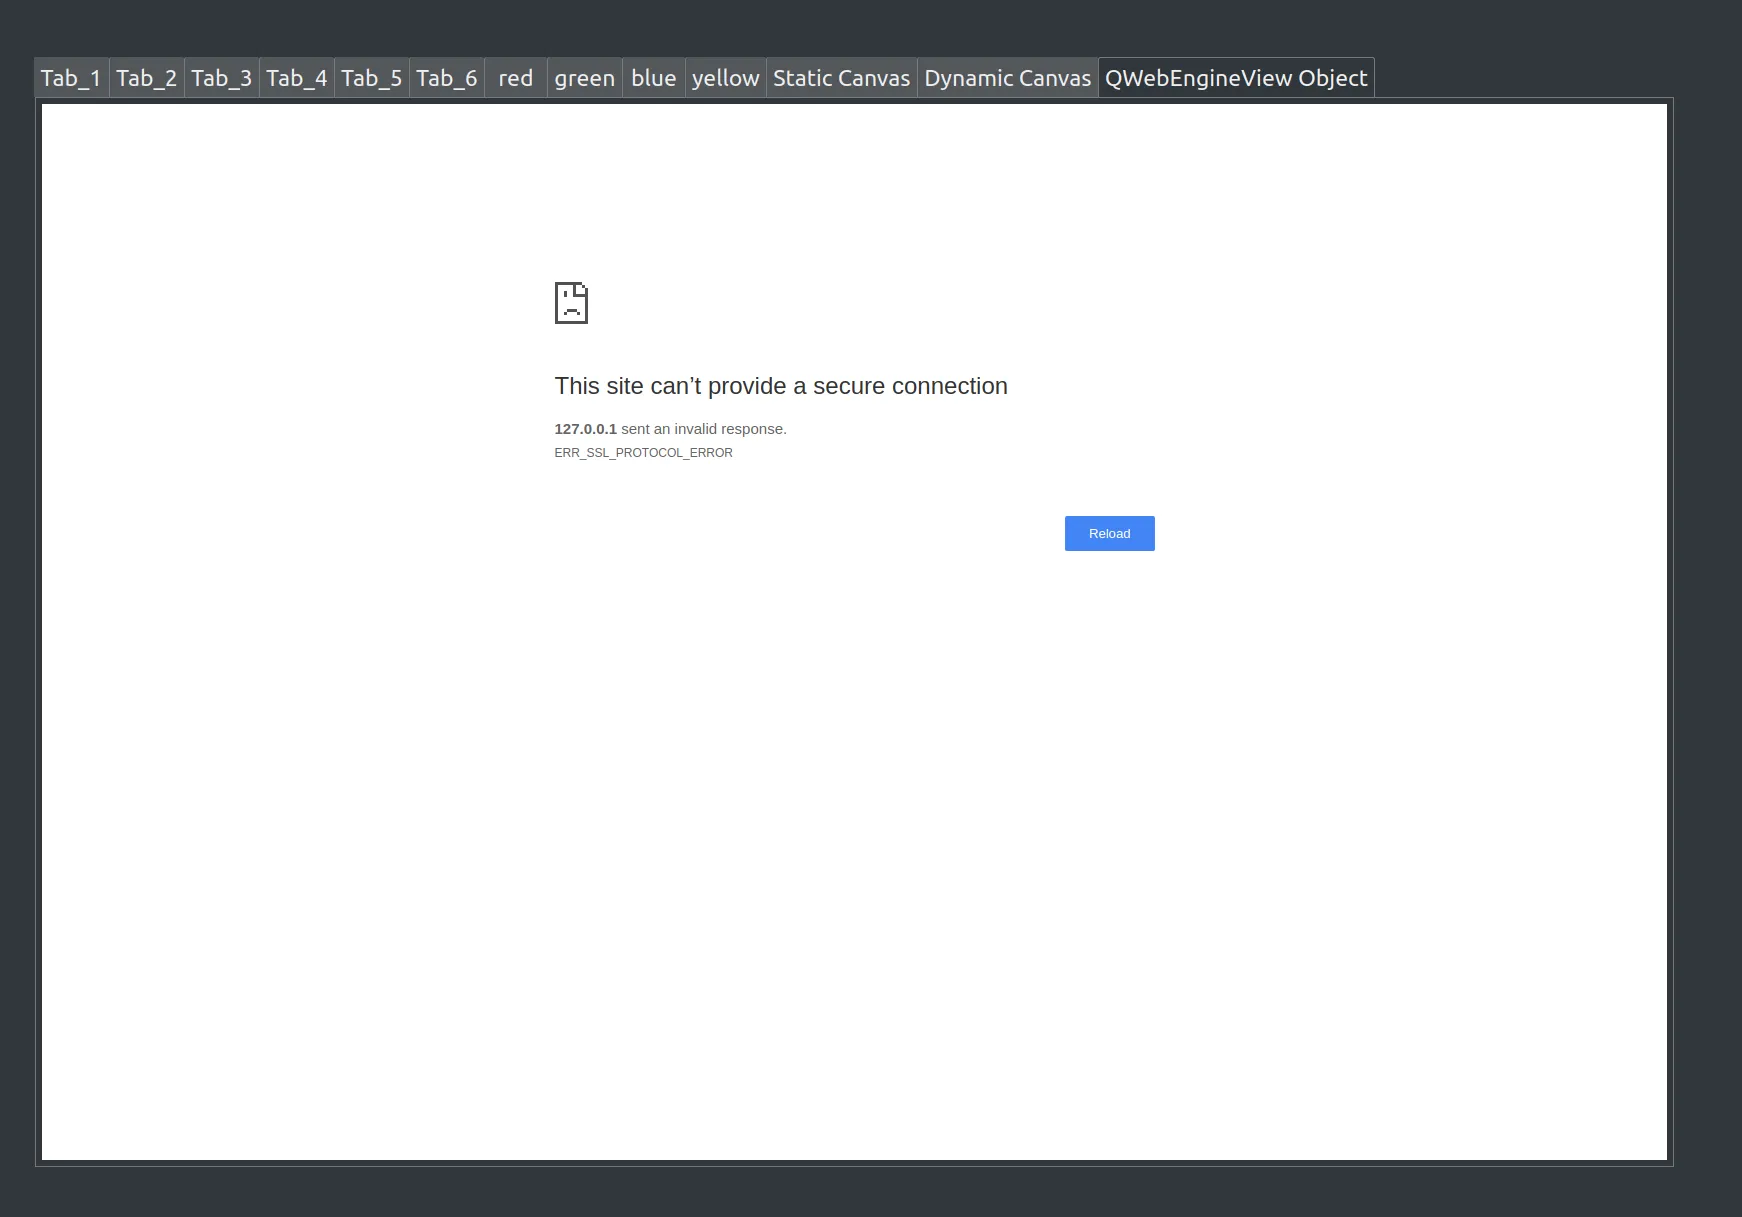
 On the GUI's Kernel, the error is "[29477:29512:0716/121826.555372:ERROR:ssl_client_socket_impl.cc(1050)] handshake failed; returned -1, SSL error code 1, net_error -107".

In the kernel running the dash plot, the message is:
127.0.0.1 - - [16/Jul/2019 12:18:26] code 400, message Bad request version ('**À+À/À,À0̨̩À\x13À\x14\x00\x9c\x00\x9d\x00/\x005\x00')

127.0.0.1 - - [16/Jul/2019 12:18:26] "µ±ª~ÜÎÌDñB¤¦jËfM½;*÷hå¸GÛ¼i©Tè**À+À/À,À0̨̩ÀÀ/5" HTTPStatus.BAD_REQUEST -
这只发生在 QTabsWidget 中。Dash 绘图在单独的独立应用程序中可以正常显示(下面提供了作为占位符 Dash 绘图的工作代码)。
Dash 绘图在简单的 PyQt5 GUI 中成功显示。
Dash Plot Working Code:
import sys
import threading
from PyQt5 import QtWidgets
import dash
import dash_core_components as dcc
import dash_html_components as html


def run_dash(data, layout):
    app = dash.Dash()
    app.layout = html.Div(children=[
        html.H1(children='Hello Dash'),
        html.Div(children='''
            Dash: A web application framework for Python.
        '''),
        dcc.Graph(
            id='example-graph',
            figure={
                'data': data,
                'layout': layout
            })
        ])
    app.run_server(debug=False)


class MainWindow(QtWidgets.QMainWindow):
    pass

if __name__ == '__main__':
    data = [
        {'x': [1, 2, 3], 'y': [4, 1, 2], 'type': 'bar', 'name': 'SF'},
        {'x': [1, 2, 3], 'y': [2, 4, 5], 'type': 'bar', 'name': u'Montréal'},
    layout = {
        'title': 'Dash Data Visualization'
    }

    threading.Thread(target=run_dash, args=(data, layout), daemon=True).start()
    app = QtWidgets.QApplication(sys.argv)
    mainWin = MainWindow()
    mainWin.show()
    sys.exit(app.exec_())
运行此代码后,内核提供绘图的地址。在我的机器上,它是http://127.0.0.1:8050。
GUI嵌入式代码原型:
import sys
from PyQt5.QtCore import *
from PyQt5.QtWebEngineWidgets import *
from PyQt5.QtWidgets import QApplication

app = QApplication(sys.argv)

web = QWebEngineView()
#web.load(QUrl("https://www.google.com"))
web.load(QUrl("http://127.0.0.1:8050"))
web.show()

sys.exit(app.exec ())
我的实际PyQt5 GUI中的代码片段:
web = QWebEngineView()
# web.load(QUrl("https://www.google.com")) web.load(QUrl("https://127.0.0.1:8050/"))
web.show()
self.ui.TabsContainer.addTab(web, "QWebEngineView Object")
# TabsContainer is a QTabsWidget
我该如何解决阻止我将图表嵌入GUI的错误?
编辑:我认为这可能与QTabWidget有关,因此我编写了以下简单代码来测试这个想法,我的Dash图表显示正常。但是,在我需要它的主多线程GUI中,尽管以相同的方式构建,但它不会显示。
import sys
from PyQt5.QtCore import *
from PyQt5.QtWebEngineWidgets import *
from PyQt5.QtWidgets import *
from PyQt5.QtGui import *


class CustomMainWindow(QMainWindow):  # MainWindow is a subclass of QMainWindow
    def __init__(self, *args, **kwargs):
        super(CustomMainWindow, self).__init__(*args, **kwargs)
#        a = 1

        self.setWindowTitle("Window Title")

        label = QLabel("Label")
        label.setAlignment(Qt.AlignCenter)
#
        layout = QVBoxLayout()
#        layout.addWidget(Color('red'))
#        layout.addWidget(Color('green'))
        layout.addWidget(Color('blue'))

        TW = QTabWidget()


        web1 = QWebEngineView()
        web1.load(QUrl("http://www.google.com"))
        #web1.load(QUrl("http://127.0.0.1:8050"))

        web2 = QWebEngineView()
        web2.load(QUrl("http://127.0.0.1:8050"))

        TW.addTab(web1, 'web1')
        TW.addTab(web2, 'web2')
        layout.addWidget(TW)


        widget = QWidget()
        widget.setLayout(layout)
        self.setCentralWidget(widget)

class Color(QWidget):

    def __init__(self, color, *args, **kwargs):
        super(Color, self).__init__(*args, **kwargs)
        self.setAutoFillBackground(True)

        palette = self.palette()
        palette.setColor(QPalette.Window, QColor(color))
        self.setPalette(palette)


app = QApplication(sys.argv)

CMWindow = CustomMainWindow()  # Instead of using QMainWindow, we now use our custom window subclassed from QMainWindow
CMWindow.show()
sys.exit(app.exec ())