确定一个颜色是否在OpenCV轮廓内

3

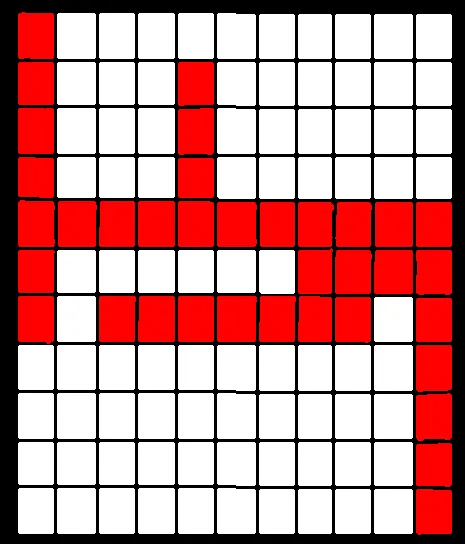
我是一名全新的图像处理者,遇到了一个问题。我有这张图片:
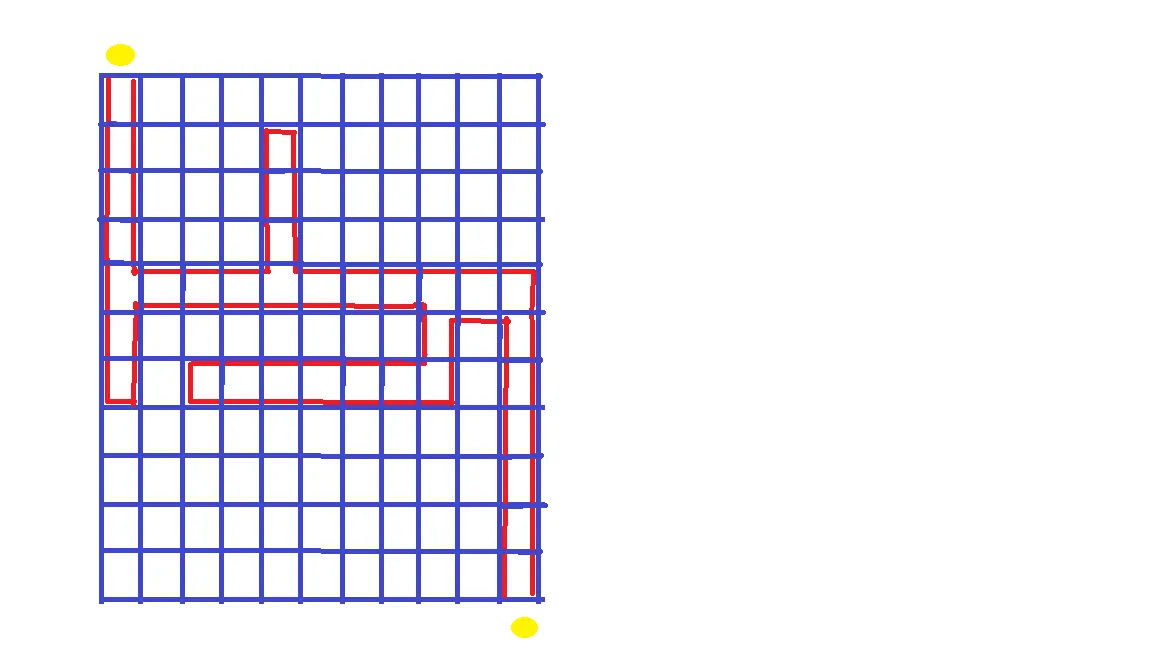
enter image description here

我的目标是将其转换为一个矩阵,如果单元格内有红色,则为1,如果没有,则为0。
因此,这将是:
10000000000
10001000000
10001000000
10001000000
11111111111
10000000101
10111111101
etc...

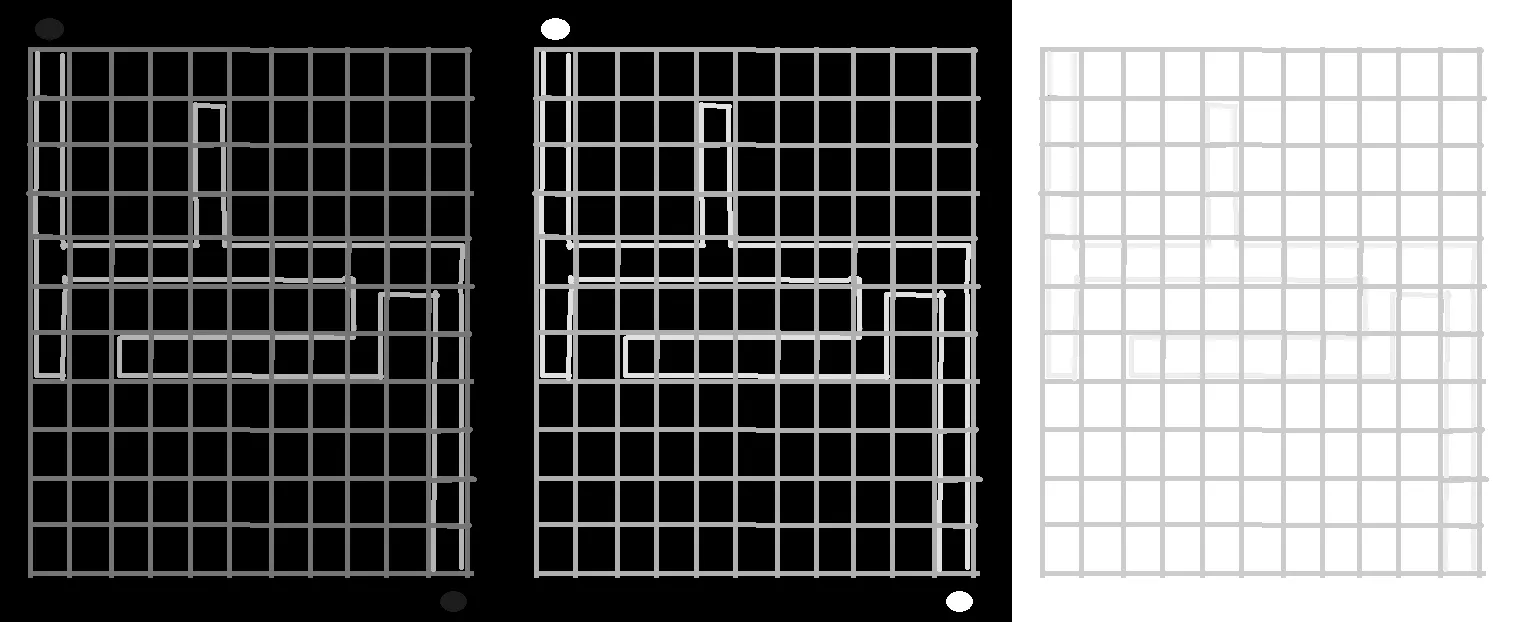
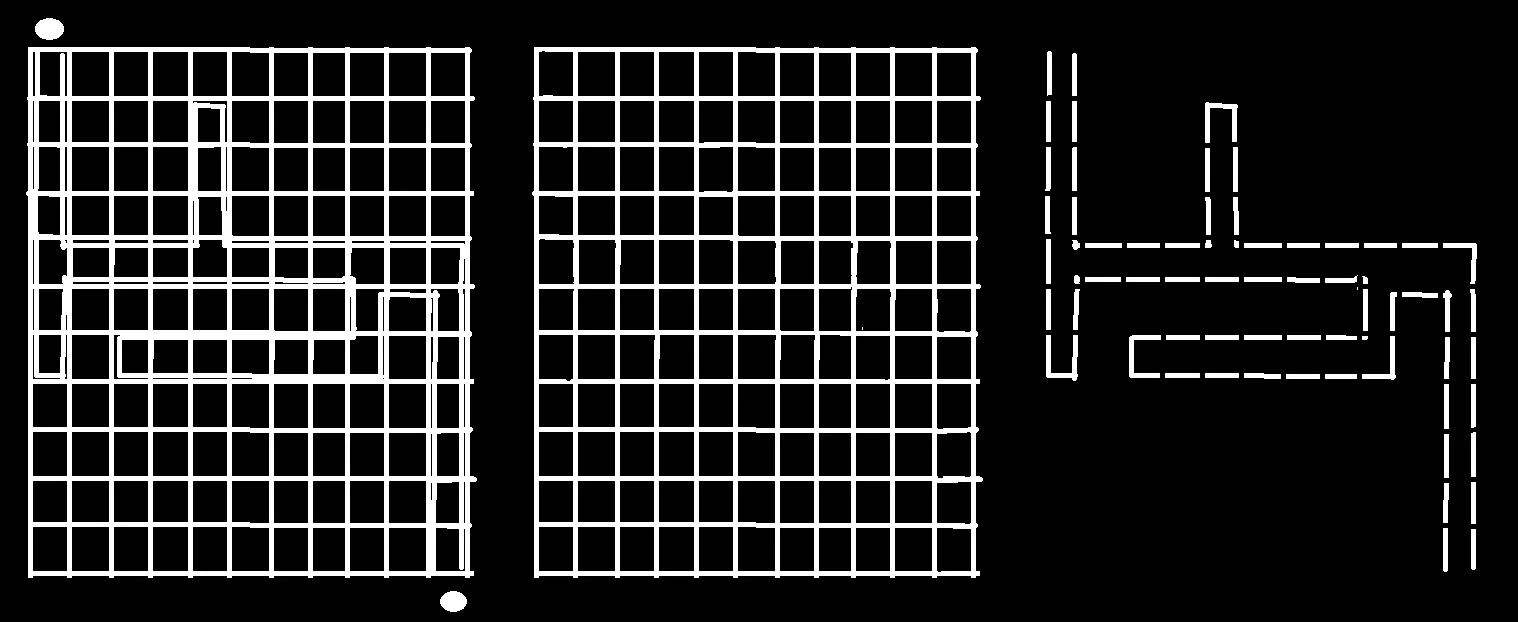
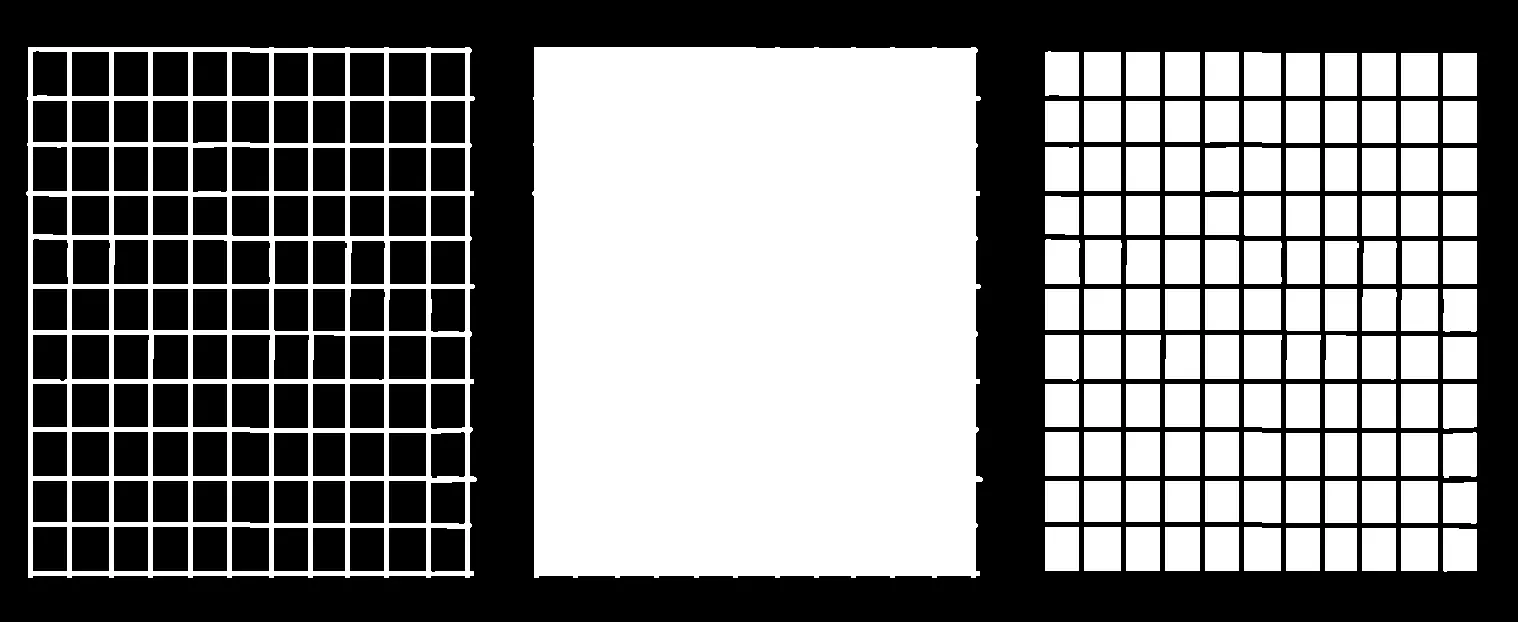
我有一段代码,它可以提取轮廓并使用approxPolyDP来确定4个角边缘的(x,y)坐标。

Contours shown in white

现在我需要找出如何确定每个轮廓中是否有特定颜色(红色)。

这是我的一些代码:希望有人能帮忙!

def extract_cells(grid):
    #convert to gray
    image_gray = cv2.cvtColor(grid, cv2.COLOR_BGR2GRAY)
    #creates a binary image from the gray scale image to use as input for findContours()
    #thresh = cv2.adaptiveThreshold(image_gray,255,cv2.ADAPTIVE_THRESH_MEAN_C,cv2.THRESH_BINARY_INV,11,15)

    #Find countors
    tempimg, contours, hierarchy = cv2.findContours(image_gray, cv2.RETR_LIST, cv2.CHAIN_APPROX_SIMPLE)

    #draw all countours
    count = 0
    max_size = 0
    matrix = [] 
    new_contours = []
    grid_contour = 0
    grid_contour_row = None
    grid_contour_column = None
    for each in enumerate(contours):

        #used to find the midpoint of each cell
        M = cv2.moments(contours[count])
        row = int(M['m10']/M['m00'])
        column = int(M['m01']/M['m00'])

        #find biggest box (this is the grid itself, so needs to be removed since it is not a cell)
        size = cv2.contourArea(contours[count])
        if (size > max_size):
            new_contours.append(contours[grid_contour])
            #put a marker in each cell for testing
            #if (grid_contour_row != None and grid_contour_column != None):
                #cv2.putText(grid, "0", (grid_contour_row, grid_contour_column), cv2.FONT_HERSHEY_SIMPLEX, 1, (255,255,255))
            grid_contour = count
            grid_contour_row = row
            grid_contour_column = column
        else:
            new_contours.append(contours[count])
            #put a marker in each cell for testing
            #cv2.putText(grid, "0", (row, column), cv2.FONT_HERSHEY_SIMPLEX, 1, (255,255,255))

        #matrix = create_matrix(matrix,count)
        count += 1

    #draw white lines showing contours
    cv2.drawContours(grid, new_contours, -1, (255,255,255))

    #approx contains x,y coordinates for the 4 corners of the cell
    approx = cv2.approxPolyDP(contours[0],0.01*cv2.arcLength(contours[0],True),True)

    cv2.imshow("test", grid)
    cv2.waitKey(0)
    return new_contours, approx


def identify_colors(image, *colors):
    colorlist = []
    #Add RGB values for each color specified when the function was called
    #to the list colorlist

    if "blue" in colors:
        colorlist.append(([115,0,0], [255,100,100]))
    if "white" in colors:
        colorlist.append(([215, 215, 215], [255, 255, 255]))
    if "red" in colors:
        colorlist.append(([0,0,100], [100,100,255]))
    if "green" in colors:
        colorlist.append(([0,115,0], [100,255,100]))

    #loop over the colorlist
    for (lower, upper) in colorlist:
        # create NumPy arrays from the colorlist
        lower = np.array(lower, dtype = "uint8")
        upper = np.array(upper, dtype = "uint8")

        #econverts image to b/w with white being anything in the BGR value range
        mask = cv2.inRange(image, lower, upper)
        #converts that specified range back to its orginal color
        output = cv2.bitwise_and(image, image, mask = mask)

        #show the photos side by side
        #cv2.imshow("images", np.hstack([image, output]))
        #cv2.waitKey(0)

    return output

所以,我的理解是,你有每个“白盒子”边缘坐标,对吗?你可以循环遍历找到的每个白盒子,并且对于每个盒子,你可以查看原始图像(使用盒子的坐标)是否有红色像素。如果找到一个,将其标记为1。你甚至可以使用白盒子的坐标来裁剪(复制)原始图像,通过创建一个新的Mat - 然后你只需要查看裁剪后的Mat是否有红色像素... - Leonardo Alves Machado
这也是我所想的。但是我不确定如何使用我拥有的坐标循环遍历图像。你能给个例子吗?抱歉,我是新手 :) - Ashley
使用小框的边缘坐标,您可以通过在图像矩阵中寻址来提取子图像/感兴趣区域/ROI。在该子图像中,您可以使用cv2.inrange查找颜色。请参考http://docs.opencv.org/3.1.0/d6/d00/tutorial_py_root.html#gsc.tab=0的教程。 - tfv
3个回答

3

如果使用scipy.ndimage.label(),则会简单得多:

from scipy import ndimage
import cv2
import numpy as np
import pandas as pd

img = cv2.imread("image.png")

blue = np.array([200, 70, 60])
red = np.array([30, 20, 220])

isblue = cv2.inRange(img, blue, blue+20)
isred = cv2.inRange(img, red, red+20) > 0

labels, count = ndimage.label(~isblue)

loc = np.where(labels >= 2) #label 1 is the border

# to get the location, we need to sort the block along yaxis and xaxis
df = pd.DataFrame({"y":loc[0], "x":loc[1], "label":labels[loc], "isred":isred[loc]})

grid = df.groupby("label").mean().sort_values("y")

def f(df):
    return df.sort_values("x").reset_index(drop=True)
res = grid.groupby((grid.y.diff().fillna(0) > 10).cumsum()).apply(f)

print((res.isred.unstack(1) > 0).astype(np.uint8))

输出结果:

    0   1   2   3   4   5   6   7   8   9   10
y                                             
0    1   0   0   0   0   0   0   0   0   0   0
1    1   0   0   0   1   0   0   0   0   0   0
2    1   0   0   0   1   0   0   0   0   0   0
3    1   0   0   0   1   0   0   0   0   0   0
4    1   1   1   1   1   1   1   1   1   1   1
5    1   0   0   0   0   0   0   1   1   1   1
6    1   0   1   1   1   1   1   1   1   0   1
7    0   0   0   0   0   0   0   0   0   0   1
8    0   0   0   0   0   0   0   0   0   0   1
9    0   0   0   0   0   0   0   0   0   0   1
10   0   0   0   0   0   0   0   0   0   0   1

0

您可以按照以下步骤进行:

  • 为红色和蓝色颜色创建掩模
  • 从蓝色掩模中,为每个小正方形创建轮廓
  • 从红色掩模中,查看红色像素是否在小正方形内

结果如下所示:

enter image description here

带有注释的代码。

我刚刚看到您需要从打印出来的列表中生成矩阵,对于每个正方形,列表包含0或1以及该正方形质心的x/y坐标。不幸的是,由于小的形状不规则性,轮廓不按“正常”顺序排序,因此您仍然需要自己对坐标进行一些排序,对此感到抱歉。

如果您想避免这种情况,也可以通过使用从某个规则网格生成的种子进行洪水填充,并循环遍历该网格来生成mask2。

import cv2
import numpy as np
img = cv2.imread('image.png')


# Define range of blue color 
lower_limit = np.array([204,72,63])
upper_limit = np.array([204,72,63])

# Generate mask for the blue pixels 
blue_colour_mask = cv2.inRange(img, lower_limit, upper_limit)

# Define range of red color 
lower_limit = np.array([36,28,237])
upper_limit = np.array([36,28,237])

# Generate mask for the red  pixels 
red_colour_mask = cv2.inRange(img, lower_limit, upper_limit)


# Remove outer black area
flooded = img.copy()
x = 5
y = 5
flooded = blue_colour_mask.copy()
h, w = blue_colour_mask.shape[:2]
mask = np.zeros((h+2, w+2), np.uint8)
mask[:] = 0
cv2.floodFill(flooded,mask,(x,y),(255,)*3, (40,)*3, (40,)*3, 4 )


# Loop through each single small rectange (contour # from 1 to 121, 0 ist image border)
_, contours, hierarchy = cv2.findContours( flooded.copy(), cv2.RETR_TREE, cv2.CHAIN_APPROX_NONE)
h, w = img.shape[:2]

result= np.zeros((h, w, 3), np.uint8)
result[:] = 0

mask2 = np.zeros((h, w), np.uint8)
list =[]

for i in range(1,122):
    mask2[:] = 0
    cv2.drawContours( mask2, contours, i, (255,255,255), cv2.FILLED)
    mask3= cv2.bitwise_and(mask2, red_colour_mask)
    pixnumber= cv2.countNonZero(mask3)

    if pixnumber == 0:
        cv2.drawContours( result, contours, i, (255,255,255), cv2.FILLED)
        moments = cv2.moments(contours[i])
        cx = int(moments['m10']/moments['m00'])
        cy = int(moments['m01']/moments['m00'])
        print 0, i, cx, cy
        list.append([0,cx, cy])
    else:
        cv2.drawContours( result, contours, i, (0,0,255), cv2.FILLED)
        moments = cv2.moments(contours[i])
        cx = int(moments['m10']/moments['m00'])
        cy = int(moments['m01']/moments['m00'])     
        print 1, i, cx, cy
        list.append([0,cx, cy])

cv2.imshow('Result',result)

cv2.waitKey(0)

print list


cv2.imshow('image',img)
cv2.imshow('Blue pixel mask',blue_colour_mask)
cv2.imshow('Red pixel mask',red_colour_mask)
cv2.imshow('Result',result)

cv2.waitKey(0)

0
import cv2
import numpy as np


def centroid(contour):
    x,y,w,h = cv2.boundingRect(contour)
    return (y+h/2.0, x+w/2.0)

def contains_red(red_mask, tile):
    tile_area = np.zeros_like(red_mask)
    cv2.drawContours(tile_area, [tile[1]], 0, 255, -1)
    red_tile_area = cv2.bitwise_and(tile_area, red_mask)
    return (cv2.countNonZero(red_tile_area) > 0)

def get_transform(grid_size, grid_contour):
    x,y,w,h = cv2.boundingRect(grid_contour)
    tile_w = float(w) / (grid_size[0])
    tile_h = float(h)/ (grid_size[1])
    return ((-y - tile_h/2, -x - tile_w/2), (1/tile_h, 1/tile_w))


img = cv2.imread("input.png")

hsv = cv2.cvtColor(img, cv2.COLOR_BGR2HSV)
h, s, v = cv2.split(hsv)

cv2.imwrite("out_1.png", np.hstack([h, s, v]))

# Saturation mask to get rid of black
s_mask = cv2.threshold(s, 10, 255, cv2.THRESH_BINARY)[1]

# Pick out blue area
blue_range = [110, 130]
blue_mask = cv2.inRange(h, blue_range[0], blue_range[1])
blue_mask = cv2.bitwise_and(blue_mask, s_mask)


# Pick out blue area
red_range = [[170, 180], [0,10]]
red_mask = cv2.bitwise_or(
    cv2.inRange(h, red_range[0][0], red_range[0][1])
    , cv2.inRange(h, red_range[1][0], red_range[1][1]))
red_mask = cv2.bitwise_and(red_mask, s_mask)

cv2.imwrite("out_2.png", np.hstack([s_mask, blue_mask, red_mask]))


kernel = cv2.getStructuringElement(cv2.MORPH_RECT, (3, 3))
# Remove noise
blue_mask = cv2.morphologyEx(blue_mask, cv2.MORPH_OPEN, kernel)
# Fill any small holes
blue_mask = cv2.morphologyEx(blue_mask, cv2.MORPH_CLOSE, kernel)


# Find outer contour, and fill area outside
cnt_grid = cv2.findContours(blue_mask.copy(), cv2.RETR_EXTERNAL, cv2.CHAIN_APPROX_NONE)[0]
assert(len(cnt_grid) == 1)
grid_area = np.zeros_like(blue_mask)
cv2.drawContours(grid_area, cnt_grid, 0, 255, -1)
grid_tiles = cv2.bitwise_and(cv2.bitwise_not(blue_mask), grid_area)

cv2.imwrite("out_3.png", np.hstack([blue_mask, grid_area, grid_tiles]))

# Find contours of our tiles
cnt_tiles = cv2.findContours(grid_tiles.copy(), cv2.RETR_EXTERNAL, cv2.CHAIN_APPROX_NONE)[0]

# Find scaling parameters
offset, scale = get_transform((11, 11), cnt_grid[0])

tiles = [[centroid(contour), contour, False] for contour in cnt_tiles]
for tile in tiles:
    # Rescale centroid
    tile[0] = (
        int(round((tile[0][0] + offset[0]) * scale[0]))
        , int(round((tile[0][1] + offset[1]) * scale[1]))
    )
    tile[2] = contains_red(red_mask, tile)

# Sort the tiles
tiles = sorted(tiles, key=lambda x: x[0], reverse=False)

# Extract the results
result = np.array([int(t[2]) for t in tiles])

print result.reshape(11,11)

我们首先将图像分割成HSV颜色空间。
色相,饱和度,明度通道:

enter image description here

由于黑色最终可能成为任何颜色,因此我们应忽略非饱和像素。

然后,我们可以使用in range提取蓝色和红色掩码,并与饱和度掩码进行按位与运算。

饱和度掩码,蓝色和红色掩码:

enter image description here

我们应用形态学开闭运算来消除噪声。

通过获取外轮廓,我们确定网格本身的区域。

然后,我们通过在反转图像上获取外轮廓来识别瓷砖区域。

蓝色掩模、网格区域掩模、瓷砖掩模:

enter image description here

接下来,我们要计算瓦片的质心。

我们假设瓦片网格大小是恒定的或由用户输入。根据网格边界框坐标,我们可以确定缩放和偏移量,以将我们的质心重新采样到范围0..10。

然后,我们可以按质心坐标对瓦片进行排序,并对其进行重塑以获得结果。

结果:

[[1 0 0 0 0 0 0 0 0 0 0]
 [1 0 0 0 1 0 0 0 0 0 0]
 [1 0 0 0 1 0 0 0 0 0 0]
 [1 0 0 0 1 0 0 0 0 0 0]
 [1 1 1 1 1 1 1 1 1 1 1]
 [1 0 0 0 0 0 0 0 1 1 1]
 [1 0 1 1 1 1 1 1 1 0 1]
 [0 0 0 0 0 0 0 0 0 0 1]
 [0 0 0 0 0 0 0 0 0 0 1]
 [0 0 0 0 0 0 0 0 0 0 1]
 [0 0 0 0 0 0 0 0 0 0 1]]

网页内容由stack overflow 提供, 点击上面的
可以查看英文原文,
原文链接