使用Telerik导出Excel(XLSX)时如何解释集合?

15

情景


我正在使用 Telerik UI For Windows forms

我在一个RadGridView上表示一个名为MarketInfo的自定义类型:

Public NotInheritable Class MarketInfo

    ...
    Public ReadOnly Property Participants As ReadOnlyCollection(Of ParticipantInfo)
        Get
            Return Me.GetParticipants()
        End Get
    End Property
    ...

End Class

它只包含文本和布尔属性,以及Participants属性,该属性返回另一种自定义类型的集合:

Private Function GetParticipants(ByVal market As XElement) As ReadOnlyCollection(Of ParticipantInfo)
    Dim participantInfoList As New List(Of ParticipantInfo)
    For Each participantNode As XElement In market...<participant>
        participantInfoList.Add(New ParticipantInfo(participantNode))
    Next
    Return New ReadOnlyCollection(Of ParticipantInfo)(participantInfoList)
End Function

这是完整的 ParticipantInfo 类:

Public NotInheritable Class ParticipantInfo

    Private ReadOnly participantElement As XElement

    Public ReadOnly Property Name As String
        Get
            Return participantElement.@name
        End Get
    End Property

    Public ReadOnly Property Id As String
        Get
            Return participantElement.@id
        End Get
    End Property

    Public ReadOnly Property Odds As String
        Get
            Return participantElement.@odds
        End Get
    End Property

    Public ReadOnly Property OddsDecimal As String
        Get
            Return participantElement.@oddsDecimal
        End Get
    End Property

    Public ReadOnly Property LastUpdateDate As String
        Get
            Return participantElement.@lastUpdateDate
        End Get
    End Property

    Public ReadOnly Property LastUpdateTime As String
        Get
            Return participantElement.@lastUpdateTime
        End Get
    End Property

    Public ReadOnly Property Handicap As String
        Get
            Return participantElement.@handicap
        End Get
    End Property

    Public Sub New(ByVal participantElement As XElement)
        Me.participantElement = participantElement
    End Sub

    Private Sub New()
    End Sub

End Class
基本上,我需要导出一个ParticipantInfo类型的集合,这个集合应该可以在Excel中表示。
好的,所以在RadGridView中,我隐藏了Participants列,因为它无法表示它(因为它是一个集合),然后我将该集合作为数据源加载到另一个RadGridView中。
为了更好地理解,这是结果: enter image description here 问题
我的问题是我不知道如何在Excel文件(XLSX)中解释这个问题。
这是我正在尝试导出MarketInfo网格内容的代码:
Dim exporter As New ExportToExcelML(rdg)
With exporter
    .HiddenColumnOption = HiddenOption.ExportAlways
    .HiddenRowOption = HiddenOption.ExportAlways
    .ExportVisualSettings = True
    .SheetMaxRows = ExcelMaxRows._65536
    .SheetName = "xxxxxxxx"
    .SummariesExportOption = SummariesOption.ExportAll
    .PagingExportOption = PagingExportOption.AllPages
    .FileExtension = ".xlsx"
    .RadGridViewToExport = rdg
    .ChildViewExportMode = ChildViewExportMode.ExportAllViews

End With

exporter.RunExport(fileName)

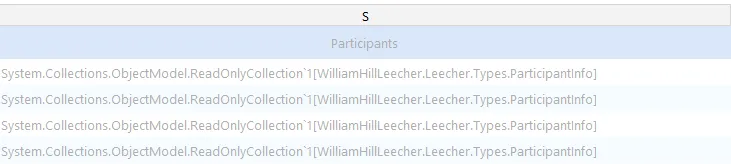
但是,生成的文件只包含参与者的类型名称:

...
<Data ss:Type="String">System.Collections.ObjectModel.ReadOnlyCollection`1[WilliamHillLeecher.Leecher.Types.ParticipantInfo]</Data></Cell></Row>
...

enter image description here

我期望看到每个MarketInfo创建一个Excel页面,包括那些缺少的属性。

我不熟悉Excel的使用和术语,不确定如何在表格页中表示集合,我想是通过创建一个新的表格页并将其“链接”到相应的单元格来完成。

我只希望在Excel文件中表示与我的应用程序中相同的信息。

问题


使用Telerik相关库如何做到这一点?

如果不能使用Telerik库实现,那么我该如何使用其他第三方免费库实现?

(这只是说我对其他类型的建议持开放态度,但请记住我已经了解更专注于Excel的库,但无论如何我仍然不明白如何使用任何库执行相同的添加/表示集合任务...也许是由于不理解如何使用Excel UI完成此任务。)

2个回答

3

感谢您的回答,第四个建议不可行,因为他们不会为超过30天的免费用户提供支持。我将尝试调查您建议的其他选项,并在这里接受答案或公开任何可能遇到的障碍,因为如何在Excel单元格中表示集合仍然不是很清楚。 - ElektroStudios

3
如果你愿意使用开源库,可以试试这个:EPPlus。一旦在你的项目中引用了 epplus.dll 文件,以下代码就可以按照你想要的方式将数据导出为 xlsx 格式:
using OfficeOpenXml.Drawing;
using OfficeOpenXml.Drawing.Chart;
using OfficeOpenXml.Style;
using OfficeOpenXml.Table;
using OfficeOpenXml.Table.PivotTable;

namespace OfficeOpenXml
{
    public static class ExcelHelper
    {

        public static void Save(dynamic Table, string path)
        {
            var excel = CreateReport(Table);
            excel.SaveAs(path);
        }
        static void Save(this ExcelPackage excel, string path)
        {
            excel.SaveAs(path);
        }
        static ExcelWorksheet Export(ExcelPackage excel, dynamic Table, out ExcelRange range) // here it is your grid
        {
            var sheet = excel.Workbook.Worksheets.Add("Master_Data");
            int row=0, col=0;
            foreach (dynamic dc in Table.Columns)
            {
                sheet.Cell(row, col++).Value = dc.Caption;
            }
            row++;
            col = 0;

            foreach (dynamic dr in Table.Rows)
            {
                foreach (object value in dr.ItemArray)
                {
                    sheet.Cell(row, col++).Value = value;
                }
                row++;
                col = 0;
            }
            range= sheet.Cells[0, 0, row - 1,  Table.Columns.Count - 1];
            return sheet;
        }

        static ExcelPackage CreateReport(dynamic Table)
        {
            var excel = new ExcelPackage();
            ExcelRange range;
            ExcelWorksheet sheet;
            sheet = Export( excel, Table, out range);

            CreatePivotTable(range, TableStyles.Medium12);
            return excel;
        }

        static ExcelPivotTable CreatePivotTable(ExcelRange range, TableStyles tableStyle)
        {
            int count = range.Worksheet.Workbook.Worksheets.Count;
            var summary = range.Worksheet.Workbook.Worksheets.Add("PivotTable" + count);
            var pivotTable = summary.PivotTables.Add(summary.Cells["A3"], range, "Summary" + count);

            pivotTable.ApplyBorderFormats = true;
            pivotTable.ApplyNumberFormats = true;

            pivotTable.TableStyle = tableStyle;

            pivotTable.WorkSheet.View.ShowGridLines = false;
            pivotTable.MultipleFieldFilters = false;
            pivotTable.RowGrandTotals = false;
            pivotTable.ColumGrandTotals = false;
            pivotTable.Compact = false;
            pivotTable.CompactData = false;
            pivotTable.GridDropZones = false;
            pivotTable.Outline = false;
            pivotTable.OutlineData = false;
            pivotTable.ShowError = true;
            pivotTable.ErrorCaption = "[error]";
            pivotTable.ShowHeaders = false;
            pivotTable.UseAutoFormatting = true;
            pivotTable.ApplyWidthHeightFormats = true;
            pivotTable.ShowDrill = true;
            //pivotTable.DataOnRows = false;
            pivotTable.WorkSheet.View.FreezePanes(pivotTable.PageFields.Count + pivotTable.ColumnFields.Count + 3, 1);


            foreach (var fld in pivotTable.Fields)
            {
                pivotTable.RowFields.Add(fld);
                fld.Compact = false;
                fld.Outline = false;
                fld.ShowAll = false;
                fld.SubtotalTop = false;
                fld.SubTotalFunctions = eSubTotalFunctions.None;
            }


            return pivotTable;
        }

    }
}

我在某些函数中使用了动态关键字,因为我不知道您的 Telerik Grid 如何访问数据,但我猜它可能具有行和列属性。如果不是这种情况,那么您将不得不更改代码的那部分。如果您正在使用 DataTable 作为网格的数据源,则可以直接传递 DataTable。创建文件后,可以使用 MS Excel 或任何支持 openxml 格式的应用程序打开它。为了获得所需的结果,您需要操作 ExcelPivotTable 对象。另请参见下面的示例报告截图:Sample Report


非常感谢您抽出时间,但这并没有回答我的问题:“如何在Excel文件中导出/表示元素数组?” 看起来您正在展示如何导出DataTable结构,我知道许多Excel库,并且我看到了很多类似的导出示例,但那不是我需要的,我需要一个具有非常具体的数组示例。无论如何,我尝试过了,但是在您提供的代码中,“sheet”对象是“ExcelWorksheet”类型,然而,该类型不公开任何“Cell”成员,而您在“Export”函数中使用它,因此,在我的一侧,我因为该成员不存在而得到编译器错误。 - ElektroStudios
1
抱歉,你是对的。Cell(row,col)是一个内部方法,我可以访问它,因为我正在使用EPPlus源代码。由于你正在使用dll,请将sheet.Cell(row, col)更改为sheet.Cells[row, col],然后它应该可以工作了。 - Mukesh Adhvaryu
我已搜索了EPPlus样例,但并未找到相关内容。也许我错了,但您所要求的任务可以通过Excel宏来完成。使用宏可能会引起安全问题,但我认为除了VB函数之外,没有其他方法可以扩展所选市场信息对象的详细信息。我建议您下载EPPlus源代码,并找出在不使用VBA宏的情况下实现您想要的功能的方法。 - Mukesh Adhvaryu

网页内容由stack overflow 提供, 点击上面的
可以查看英文原文,
原文链接