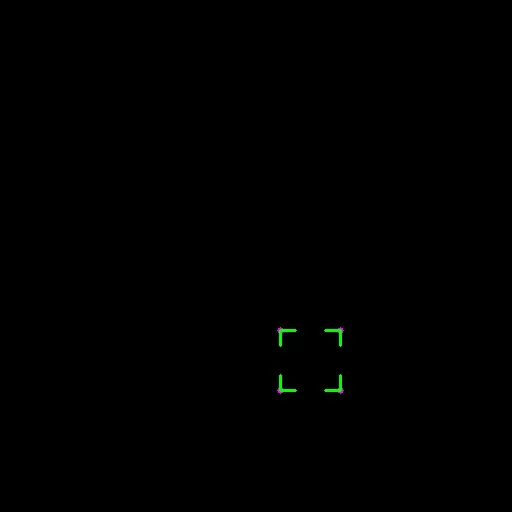
在网上搜索后,我没有找到使用Python的OpenCV画出像这张图片中的边界框的方法。它有两个特点:第一个是四个角不相连,第二个是透明边界框。我知道应该使用多边形,但我无法进一步处理。
3个回答
6
以下函数会在感兴趣的区域周围绘制一个不完整的矩形。我使用了
有一个限制。您必须按以下顺序提供4个点:左上角、左下角、右上角、右下角。
同时,您可以使用
结果:
cv2.line()两次来绘制每个点。此外,我还使用了cv2.circle()标记4个点。有一个限制。您必须按以下顺序提供4个点:左上角、左下角、右上角、右下角。
同时,您可以使用
line_length选项来改变要绘制的线的长度。
代码:
def draw_border(img, point1, point2, point3, point4, line_length):

    x1, y1 = point1
    x2, y2 = point2
    x3, y3 = point3
    x4, y4 = point4

    cv2.circle(img, (x1, y1), 3, (255, 0, 255), -1)    #-- top_left
    cv2.circle(img, (x2, y2), 3, (255, 0, 255), -1)    #-- bottom-left
    cv2.circle(img, (x3, y3), 3, (255, 0, 255), -1)    #-- top-right
    cv2.circle(img, (x4, y4), 3, (255, 0, 255), -1)    #-- bottom-right

    cv2.line(img, (x1, y1), (x1 , y1 + line_length), (0, 255, 0), 2)  #-- top-left
    cv2.line(img, (x1, y1), (x1 + line_length , y1), (0, 255, 0), 2)

    cv2.line(img, (x2, y2), (x2 , y2 - line_length), (0, 255, 0), 2)  #-- bottom-left
    cv2.line(img, (x2, y2), (x2 + line_length , y2), (0, 255, 0), 2)

    cv2.line(img, (x3, y3), (x3 - line_length, y3), (0, 255, 0), 2)  #-- top-right
    cv2.line(img, (x3, y3), (x3, y3 + line_length), (0, 255, 0), 2)

    cv2.line(img, (x4, y4), (x4 , y4 - line_length), (0, 255, 0), 2)  #-- bottom-right
    cv2.line(img, (x4, y4), (x4 - line_length , y4), (0, 255, 0), 2)

    return img

line_length = 15

img = np.zeros((512,512,3), np.uint8)
cv2.imshow('img', img)

point1, point2, point3, point4 = (280,330), (280,390), (340,330), (340,390)
fin_img = draw_border(img, point1, point2, point3, point4, line_length)

cv2.imshow('fin_img', fin_img)

cv2.waitKey()
cv2.destroyAllWindows()
结果:
结果:
- Jeru Luke
1
-1
此外,如果有人需要:在 C 中带有圆角的花哨矩形:
然而我需要这个代码在 Python 中,社区给出了答复。
void draw_border(IplImage* show_img, CvPoint pt1, CvPoint pt2, CvScalar color, int thickness, int r, int d):

        // Top left
        cvLine(show_img, cvPoint( pt1.x +r, pt1.y), cvPoint( pt1.x + r + d, pt1.y), color, thickness, 8, 0 );
        cvLine(show_img, cvPoint( pt1.x, pt1.y + r), cvPoint( pt1.x, pt1.y + r + d), color, thickness, 8, 0 );
        cvEllipse(show_img, cvPoint(pt1.x +r, pt1.y + r), cvSize( r, r ), 180, 0, 90, color, thickness, 8, 0);

        // Top right
            cvLine(show_img, cvPoint( pt2.x - r, pt1.y), cvPoint( pt2.x - r - d, pt1.y), color, thickness,  8, 0 );
            cvLine(show_img, cvPoint( pt2.x, pt1.y + r), cvPoint( pt2.x, pt1.y + r + d), color, thickness,  8, 0 );
        cvEllipse(show_img, cvPoint(pt2.x -r, pt1.y + r), cvSize( r, r ), 270, 0, 90, color, thickness, 8, 0);


            // Bottom left
            cvLine(show_img, cvPoint( pt1.x + r, pt2.y), cvPoint( pt1.x + r + d, pt2.y), color, thickness,  8, 0);
            cvLine(show_img, cvPoint( pt1.x, pt2.y - r), cvPoint( pt1.x, pt2.y - r - d), color, thickness,  8, 0);
        cvEllipse(show_img, cvPoint(pt1.x  + r, pt2.y - r), cvSize( r, r ), 90, 0, 90, color, thickness, 8, 0);

            // Bottom right
            cvLine(show_img, cvPoint( pt2.x - r, pt2.y), cvPoint( pt2.x - r - d, pt2.y), color, thickness, 8, 0);
            cvLine(show_img, cvPoint( pt2.x, pt2.y - r), cvPoint( pt2.x, pt2.y - r - d), color, thickness, 8, 0);
        cvEllipse(show_img, cvPoint(pt2.x  - r, pt2.y - r), cvSize( r, r ), 0, 0, 90, color, thickness, 8, 0);
- Majid Azimi
-1
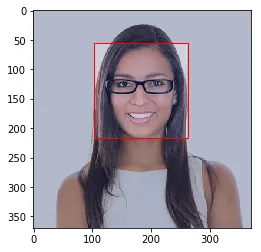
试试这段代码。也许对你有帮助。
代码:
import matplotlib.pyplot as plt
import matplotlib.patches as patches
from PIL import Image
import numpy as np

image = np.array(Image.open('Image.jpg'), dtype=np.uint8)

# Create figure and axes
fig,ax = plt.subplots(1)

# Display the image
ax.imshow(image)

# Create a Rectangle patch
rect = patches.Rectangle((102,55),160,162,linewidth=1,edgecolor='r',facecolor='none')

# Add the patch to the Axes
ax.add_patch(rect)

plt.show()
图像输出:
- Muhammad Usman
1
1谢谢穆罕默德,但这不是我需要的。请查看已接受的回答。 - Majid Azimi
网页内容由stack overflow 提供, 点击上面的可以查看英文原文,
原文链接
原文链接