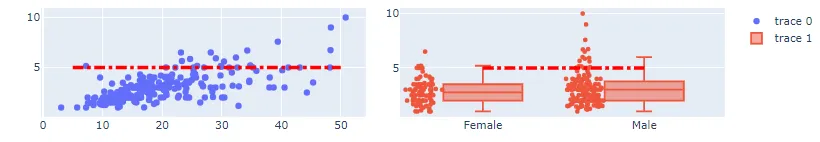
我希望在下面的图表中添加一条水平线,以便它也出现在图例中。目标是通过单击图例来允许用户选择使该行出现或消失。 有什么想法吗?
import plotly.graph_objects as go

tips = px.data.tips()
fig = make_subplots(rows=2, cols=2, shared_xaxes=False, vertical_spacing=0.3,horizontal_spacing=0.05)

#Scatter plot
fig.append_trace(go.Scatter(
        x=tips['total_bill'],
        y=tips['tip'],
        mode = 'markers',
        marker=dict( size=7),
        showlegend = True),
        row=1, col=1)

#Box plot
fig.add_trace(go.Box(
            y=tips['tip'],
            x = tips['sex'],
            boxpoints='all',jitter=0.5,whiskerwidth=0.2,marker_size=5,line_width=2),
            row=1, col=2)

#Add horizontal lines
shapes = [
{'type': 'line','x0': 5,'y0': 5,
'x1': 50,'y1' : 5,'xref': 'x1',
'yref': 'y1','line': {'color': 'red','width': 4, 'dash':'dashdot'}},

{'type': 'line','x0': 'Female','y0': 5,
'x1': 'Male','y1' : 5,'xref': 'x2',
'yref': 'y2','line': {'color': 'red','width': 4, 'dash':'dashdot'}},
        ]

fig['layout'].update(shapes=shapes)

fig.show()
showlegend设置为 False。如果您希望一个图例条目控制两个子图,您需要使用legendgroup参数。这里提供了 R 的示例:https://dev59.com/DlkS5IYBdhLWcg3wYlzV#46157158。因此,这不是完整的答案,但可能会有所帮助 :) - dschingchris