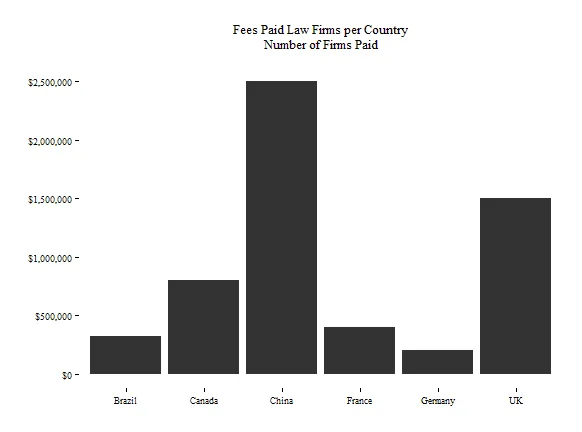
是否可以在条形图上方添加边际线?使用以下数据集,如何在巴西上方添加4个边际线,在加拿大上方添加8个边际线,等等。
ctryfees <- feesctry %>% group_by(country) %>% summarise(total = sum(fees))

library(ggplot2)
library(ggthemes)

ggplot(ctryfees, aes(x = country, y = total)) +
  geom_bar(stat = "identity") + theme_tufte() +
  ggtitle("Fees Paid Law Firms per Country\nNumber of Firms Paid\n") +
  labs(x = "", y = "") +
  scale_y_continuous(label = dollar.format) +
  geom_rug(data = feesctry, mapping = aes(x = country, y = firms), sides = "top")
代码在添加了scale_y_continuous这一行之后不起作用,因为它会抛出此错误:
Error: Discrete value supplied to continuous scale
> dput(feesctry)
structure(list(country = structure(c(1L, 1L, 1L, 1L, 2L, 3L,
4L, 4L, 5L, 5L, 6L, 2L, 2L, 2L, 2L, 2L, 2L, 2L, 6L, 6L, 3L, 3L,
3L, 3L), .Label = c("Brazil", "Canada", "China", "France", "Germany",
"UK"), class = "factor"), firms = structure(c(1L, 2L, 3L, 4L,
5L, 13L, 18L, 19L, 20L, 21L, 22L, 6L, 7L, 8L, 9L, 10L, 11L, 12L,
23L, 24L, 14L, 15L, 16L, 17L), .Label = c("brazil1", "brazil2",
"brazil3", "brazil4", "can1", "can2", "can3", "can4", "can5",
"can6", "can7", "can8", "china1", "china2", "china3", "china4",
"china5", "france1", "france2", "german1", "german2", "uk1",
"uk2", "uk3"), class = "factor"), fees = c(80000, 80000, 80000,
80000, 1e+05, 5e+05, 2e+05, 2e+05, 1e+05, 1e+05, 5e+05, 1e+05,
1e+05, 1e+05, 1e+05, 1e+05, 1e+05, 1e+05, 5e+05, 5e+05, 5e+05,
5e+05, 5e+05, 5e+05)), .Names = c("country", "firms", "fees"), row.names = c(NA,
-24L), class = "data.frame")
ctryfees <- feesctry %>% group_by(country) %>% summarise(total = sum(fees), n = n()) %>% mutate(country = reorder(country, total)),然后再加上+ geom_rug(aes(x = jitter(rep(as.numeric(country), n)), y = 1), sides = "top")。 - lukeA