我正在尝试对由蛋白质DNA相互作用构成的数据集进行聚类,并生成一个热图,以显示结果数据,使数据在对角线上排列。我能够对数据进行聚类并生成该数据的树状图,但是当我使用R中的heatmap函数生成数据的热图时,聚类不可见。如果您查看前两个图片,其中一个是我能够生成的树状图,第二个是我能够生成的热图,第三个只是一个聚类热图的示例,展示了我大致期望的结果。从比较第二和第三张图片可以看出,第三张图片中有聚类,而第二张图片中没有。这是我的数据集链接:http://pastebin.com/wQ9tYmjy
我能够在R中对数据进行聚类并生成图像:
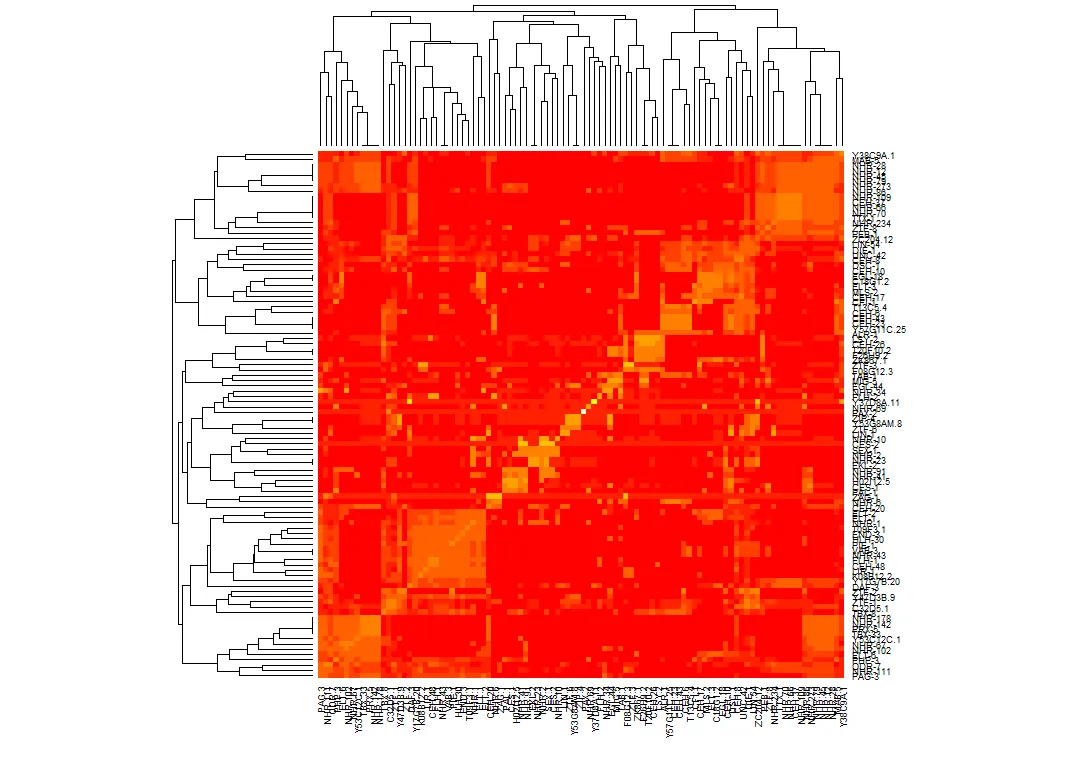
我同样也能够生成热力图:
args <- commandArgs(TRUE);
matrix_a <- read.table(args[1], sep='\t', header=T, row.names=1);
location <- args[2];
matrix_d <- dist(matrix_a);
hc <- hclust(matrix_d,"average");
mypng <- function(filename = "mydefault.png") {
png(filename)
}
options(device = "mypng")
plot(hc);
matrix_a <- read.table("Arda_list.txt.binary.matrix.txt", sep='\t', header=T, row.names=1);
mtscaled <- as.matrix(scale(matrix_a))
heatmap(mtscaled, Colv=F, scale='none')
我尝试按照Christopher Bare的帖子http://digitheadslabnotebook.blogspot.com/2011/06/drawing-heatmaps-in-r.html进行操作,但是我似乎漏掉了什么。任何想法都将不胜感激。我附上了我得到的热图和树形图像,第三张图片来自Christopher Bare的帖子。谢谢。