我正在使用matplotlib进行图表绘制。我已经准备好了plot和errorbar。我想在误差线旁边的文本中指定误差值。我希望得到这样的效果(在Pinta中编辑):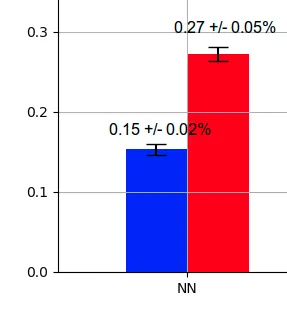 是否有可能在这段代码中实现此功能:
是否有可能在这段代码中实现此功能:
import numpy as np
import matplotlib.pyplot as plt
import math

N = 8

y1 = [0.1532, 0.1861, 0.2618, 0.0584, 0.1839, 0.2049, 0.009, 0.2077]
y1err = []

for item in y1:
    err = 1.96*(math.sqrt(item*(1-item)/10000))
    y1err.append(err)

ind = np.arange(N)
width = 0.35

fig, ax = plt.subplots()

ax.bar(ind, y1, width, yerr=y1err, capsize=7)

ax.grid()
plt.show()