当使用黑色背景的ggplot2主题时,能否控制图例颜色以指导其他颜色指南,使得图例不会被绘制成黑色?如果可以,怎么做呢?
library(ggplot2) # needs to be 0.9.3 for this theme
data(iris)       # included with ggplot2

theme_black<- function (base_size = 16, base_family = ""){
    theme_minimal() %+replace%
        theme(
              line = element_line(colour = "white", size = 0.5, linetype = 1,
                        lineend = "butt"),
              rect = element_rect(fill = "white",
                        colour = "white", size = 0.5, linetype = 1),
              text = element_text(family = base_family,
                        face = "plain", colour = "white", size = base_size,
                        angle = 0, lineheight = 0.9, hjust = 0, vjust = 0),
              plot.background = element_rect(colour = 'black', fill = 'black'),
              plot.title = element_text(size = rel(1.2)),
              panel.border = element_rect(fill = NA, colour = "white"),
              panel.grid.major = element_line(colour = "grey20", size = 0.2),
              panel.grid.minor = element_line(colour = "grey5", size = 0.5),
              strip.background = element_rect(fill = "grey30", colour = "grey30")
             )
    }

ggplot(data=iris, aes(x=Sepal.Length, y=Sepal.Width, shape=Species,
       colour=Petal.Length))+geom_point()+theme_black()+
       scale_colour_gradient(low = "purple", high = "white")
如您所见,图例形状部分的默认颜色未更改,因此它是不可见的,人们无法确定哪个物种是哪个:
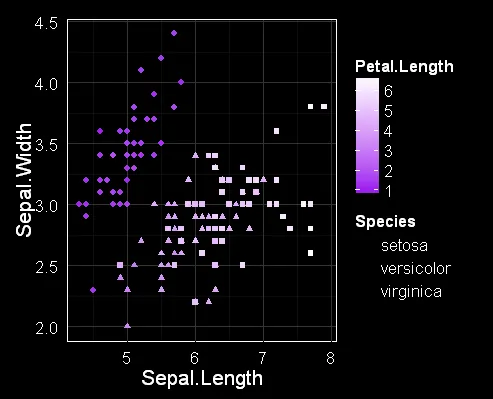
我目前唯一的解决方案是更改图例背景颜色,但这是浪费墨水和丑陋的。
+ guides(shape=guide_legend(override.aes=list(colour="white")))。不幸的是,theme()不能用于更改默认点颜色之类的东西。 - bdemarest