如何在图像分类中为马赛克增强创建类标签?

8

更新

现在已正式由 keras-cv 支持。


在生成具有 CutMixMixUp 增强类型的类标签时,我们可以使用像 np.random.betascipy.stats.beta 这样的 beta 函数,并对两个标签执行以下步骤:
label = label_one*beta + (1-beta)*label_two

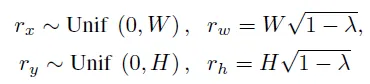
但是如果我们有超过两张图片呢?在YoLo4中,他们尝试了一种有趣的增强叫做Mosaic Augmentation,用于解决目标检测问题。与CutMixMixUp不同,这种增强会创建带有4张图像的增强样本。在目标检测案例中,我们可以计算每个实例坐标的偏移量,从而可能获得适当的真实值,这里。但对于仅图像分类案例,我们该怎么办呢?

这里是一个入门

import tensorflow as tf
import matplotlib.pyplot as plt 
import random

(train_images, train_labels), (test_images, test_labels) = \
tf.keras.datasets.cifar10.load_data()
train_images = train_images[:10,:,:]
train_labels = train_labels[:10]
train_images.shape, train_labels.shape

((10, 32, 32, 3), (10, 1))

这是我们为此增强编写的一个函数;(使用“内部-外部循环”太丑陋了!如果可以高效地完成,请提出建议。)

def mosaicmix(image, label, DIM, minfrac=0.25, maxfrac=0.75):
    '''image, label: batches of samples 
    '''
    xc, yc  = np.random.randint(DIM * minfrac, DIM * maxfrac, (2,))
    indices = np.random.permutation(int(image.shape[0]))
    mosaic_image = np.zeros((DIM, DIM, 3), dtype=np.float32)
    final_imgs, final_lbs = [], []

    # Iterate over the full indices 
    for j in range(len(indices)): 
        # Take 4 sample for to create a mosaic sample randomly 
        rand4indices = [j] + random.sample(list(indices), 3) 
        
        # Make mosaic with 4 samples 
        for i in range(len(rand4indices)):
            if i == 0:    # top left
                x1a, y1a, x2a, y2a =  0,  0, xc, yc
                x1b, y1b, x2b, y2b = DIM - xc, DIM - yc, DIM, DIM # from bottom right        
            elif i == 1:  # top right
                x1a, y1a, x2a, y2a = xc, 0, DIM , yc
                x1b, y1b, x2b, y2b = 0, DIM - yc, DIM - xc, DIM # from bottom left
            elif i == 2:  # bottom left
                x1a, y1a, x2a, y2a = 0, yc, xc, DIM
                x1b, y1b, x2b, y2b = DIM - xc, 0, DIM, DIM-yc   # from top right
            elif i == 3:  # bottom right
                x1a, y1a, x2a, y2a = xc, yc,  DIM, DIM
                x1b, y1b, x2b, y2b = 0, 0, DIM-xc, DIM-yc    # from top left
                
            # Copy-Paste
            mosaic_image[y1a:y2a, x1a:x2a] = image[i,][y1b:y2b, x1b:x2b]

        # Append the Mosiac samples
        final_imgs.append(mosaic_image)
        
    return final_imgs, label
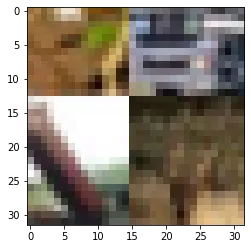
目前带有错误标签的增强样本。

data, label = mosaicmix(train_images, train_labels, 32)
plt.imshow(data[5]/255)

enter image description here


然而,这里有一些更多的例子来激励你。数据来自Cassava Leaf比赛。
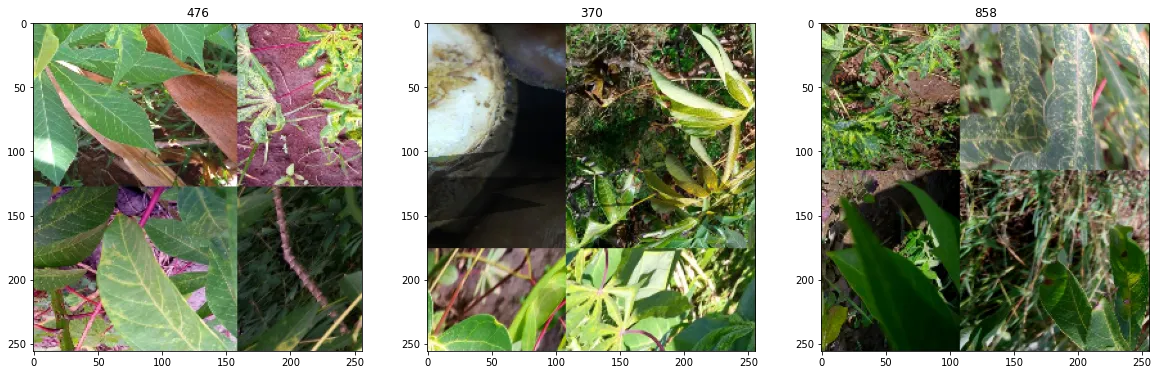

(来源:googleapis.com)


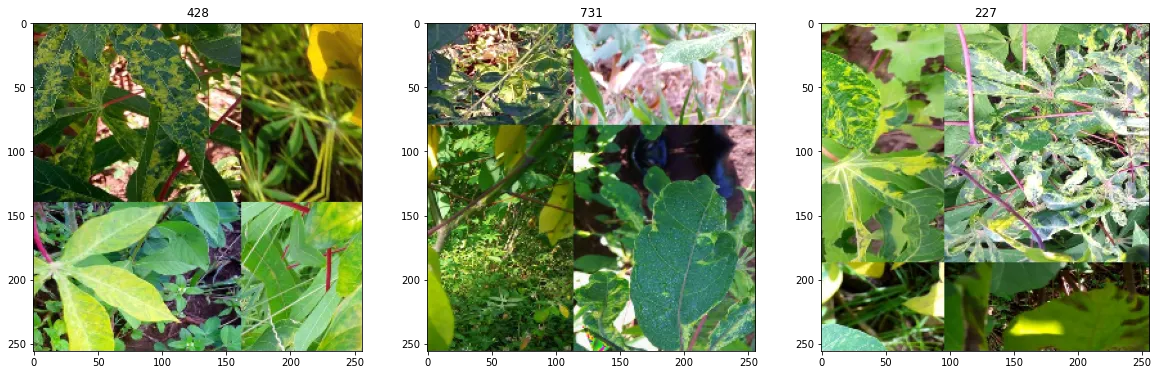
(来源: googleapis.com)

2个回答

4
我们已经知道,在CutMix中,λ是来自Beta(α,α)分布的一个浮点数。我们已经看到,当α=1时,它的表现最好。现在,如果我们总是将α设为1,我们可以说λ是从均匀分布中抽样得到的。
简单地说,λ只是一个浮点数,其值在0到1之间。
因此,仅对于2个图像,如果我们对第一个图像使用λ,那么我们可以通过1-λ来计算剩余的未知部分。
但对于3个图像,如果我们对第一个图像使用λ,则无法从单个λ中计算出其他2个未知量。如果我们真的想这样做,我们需要为3个图像生成2个随机数。同样,我们可以说对于n个图像,我们需要n-1个随机变量。在所有情况下,总和应该为1(例如,λ + (1-λ) == 1)。如果总和不是1,则标签将错误!
为此,Dirichlet分布可能会有所帮助,因为它有助于生成总和为1的量。Dirichlet分布的随机变量可以看作是Beta分布的多元推广。
>>> np.random.dirichlet((1, 1), 1)  # for 2 images. Equivalent to λ and (1-λ)
array([[0.92870347, 0.07129653]])  
>>> np.random.dirichlet((1, 1, 1), 1)  # for 3 images.
array([[0.38712673, 0.46132787, 0.1515454 ]])
>>> np.random.dirichlet((1, 1, 1, 1), 1)  # for 4 images.
array([[0.59482542, 0.0185333 , 0.33322484, 0.05341645]])

CutMix中,图像裁剪部分的大小与权重相对应的标签有关,该权重用符号λ表示。

enter image description here

enter image description here

因此,对于多个λ,您还需要相应地计算它们。
# let's say for 4 images
# I am not sure the proper way. 

image_list = [4 images]
label_list = [4 label]
new_img = np.zeros((w, h))

beta_list = np.random.dirichlet((1, 1, 1, 1), 1)[0]
for idx, beta in enumerate(beta_list):
    x0, y0, w, h = get_cropping_params(beta, full_img)  # something like this
    new_img[x0, y0, w, h] = image_list[idx][x0, y0, w, h]
    label_list[idx] = label_list[idx] * beta

1
另一种看待这个问题的方法是考虑宽度和高度维度的分隔线。在构建马赛克图像时,目标是将四张图片合成一张图片。我们可以通过在每个维度中随机采样中点(表示分离点)来实现这一目标。这消除了采样4个总和为1的数字的相当复杂的要求。相反,现在的目标是从均匀分布中采样2个独立值 - 这是一个更简单和更直观的替代方案。
因此,本质上,我们采样两个值:
w = np.random.uniform(0, 1)
h = np.random.uniform(0, 1)

为了生成逼真的马赛克图像,使每个图像都有明显的贡献,我们可以从[0.25 0.75]中抽样,而不是从[0, 1]中抽样。
这两个值足以参数化马赛克问题。 马赛克图像中的每个图像占据以下坐标跨度的区域:考虑到马赛克图像具有W x H的尺寸,每个维度的中点分别由wh表示。
 - top left     - (0, 0) to (w, h)
 - top right    - (w, 0) to (W, h)
 - bottom left  - (0, h) to (w, H)
 - bottom right - (w, h) to (W, H)

采样中点还有助于计算类标签。假设我们决定使用每个图像在马赛克中占据的面积作为其对整体类标签的相应贡献。例如,考虑属于4个类{0、1、2、3}的4个图像。现在假设0号图像占据左上角,1号图像占据右上角,2号图像占据左下角,3号图像占据右下角。我们可以按以下方式构建类标签L:


网页内容由stack overflow 提供, 点击上面的
可以查看英文原文,
原文链接