leaflet添加多个折线

6
我看到类似的问题,但目前还没有符合我的需求的(至少我理解的程度),所以如果这个问题已经被回答了,我提前道歉。同时,我对 R 也不是很熟悉。
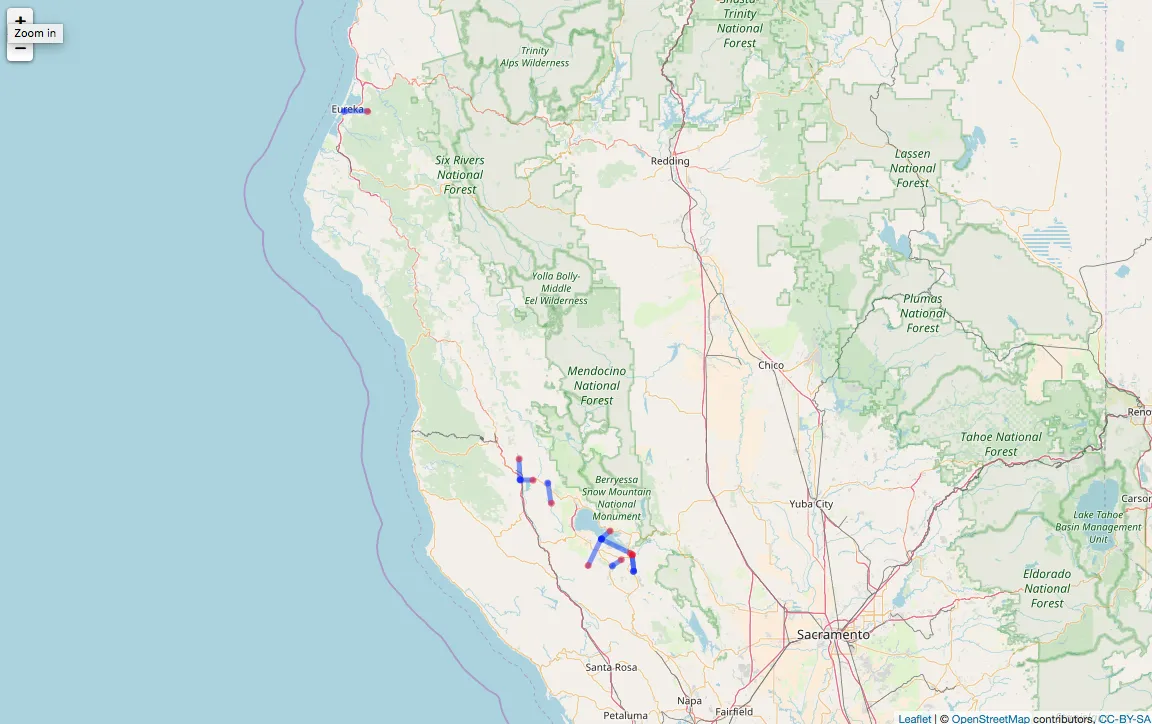
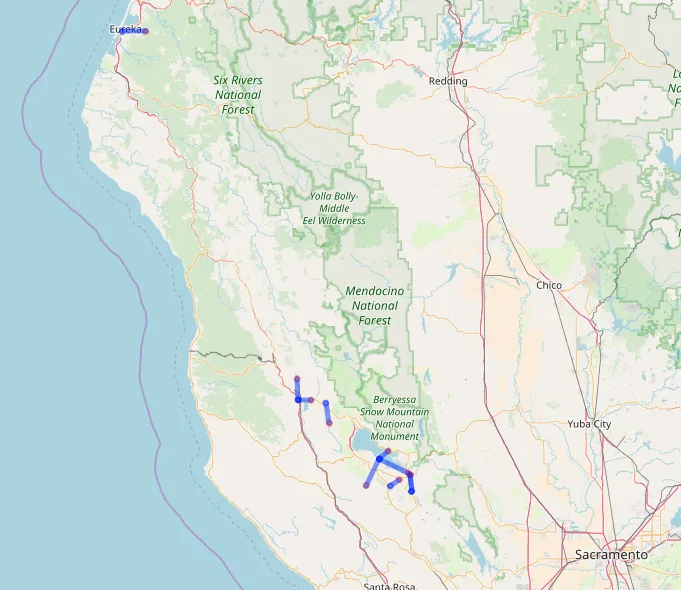
我有一个数据框,其中每行都包含两组纬度/经度。实际数据包含数百行和许多相关数据的列。我正在为这两组纬度/经度绘制点,并希望绘制连接每一对点的线作为单独的线条。这里是结果应该看起来像的示例。
这是数据的简化示例。事件和位置将会有重复的值。
Event_lat   Event_lon   Event   Location    Location_latitude   Location_longitude
40.791151   -124.054008 704832643   60005   40.790961   -124.1825609
38.900882   -122.660353 704653051   60009   38.873889   -122.709722
38.921488   -122.600049 704681147   60011   38.85111099 -122.593333
38.921488   -122.600049 704681147   60011   38.85111099 -122.593333
39.141877   -123.044724 706777142   60012   39.22794396 -123.064722
38.928113   -122.611386 708644013   60016   38.98950003 -122.7695828
39.02361    -122.72195  708582623   60016   38.98950003 -122.7695828
38.87586    -122.842684 708336092   60016   38.98950003 -122.7695828
39.239926   -123.145497 709020144   60017   39.24138798 -123.2163878
39.3307 -123.221674 708875205   60017   39.24138798 -123.2163878

这里是一个简化的示例代码,用于映射点:

library(leaflet)
myData <-read.csv("Book1.csv",header=TRUE, sep=",")
leaflet()%>%
  addTiles() %>%
  addCircles(myData,lng = myData$lsr_lon,lat = myData$lsr_lat, radius=20, color = "red",group = "events") %>% 
  addCircles(myData,lng = myData$site_longitude,lat = myData$site_latitude, radius=20, color = "blue",group = 'Locations')

  1. 您的图像似乎并未被包含在内。
  2. 请问您能否尝试运行 dput(head(your data frame))
- tjebo
2个回答

6
我提出一个使用library(sf)library(data.table)的解决方案,其中sf已经取代了sp,而data.table用于高效地重塑数据。
我正在使用Wimpel提供的数据解决方案。

重塑

创建一个sf对象非常直接。我们需要为您的每一行数据创建一个LINESTRING(作为一个sfg对象),然后转换为sf
library(sf)
library(data.table)

setDT(df)   

## create an 'id' / index value. This assumes each row of your data is a separate line. 
df[, idx := .I]

## create an `sfc` column (where each row is an `sfg` object)
sf <- df[
    , {
        geometry <- sf::st_linestring(x = matrix(c(Event_lon, Event_lat, Location_longitude, Location_latitude), ncol = 2, byrow = T))
        geometry <- sf::st_sfc(geometry)
        geometry <- sf::st_sf(geometry = geometry)
    }
    , by = idx
]

## convert to sf
sf <- sf::st_as_sf(sf)

绘图

有了这个sf对象,现在您可以在leaflet中绘图(使用类似于Wimpel的代码)

library(leaflet)

leaflet() %>%
    addTiles() %>%
    addPolylines(data = sf) %>%
    addCircles(data = df, lng = ~Event_lon, lat = ~Event_lat, radius=20, color = "red", group = "events") %>% 
    addCircles(data = df, lng = ~Location_longitude, lat = ~Location_latitude, radius=20, color = "blue", group = 'Locations') 

enter image description here


我不明白我哪里做错了,因为 setDT(df) 给我产生了一个错误: Error in setDT(df) : Cannot convert 'df' to data.table by reference because binding is locked. It is very likely that 'df' resides within a package (or an environment) that is locked to prevent modifying its variable bindings. Try copying the object to your current environment, ex: var <- copy(var) and then using setDT again. 请问你能帮我吗?谢谢。 - Alejandro Galera
你的 df 对象是什么?你尝试过 df <- copy(df) 的建议了吗? - SymbolixAU
我已经将两个数据框分开了。一个包含一行数据,另一个包含其他数据。我尝试使用行绑定的 df,但它不起作用 :( - Alejandro Galera
但是你的 df 对象是什么?你正在调用 setDT(df),那么 df 是一个 data.frame 吗? - SymbolixAU

4

我自己刚开始接触使用R和leaflet进行地理信息处理,所以这可能不是最有效的解决方法...尽管如此,它对我来说很好用...欢迎提供反馈!

结果

result

样本数据

df <- read.table( text = "Event_lat   Event_lon   Event   Location    Location_latitude   Location_longitude
40.791151   -124.054008 704832643   60005   40.790961   -124.1825609
38.900882   -122.660353 704653051   60009   38.873889   -122.709722
38.921488   -122.600049 704681147   60011   38.85111099 -122.593333
38.921488   -122.600049 704681147   60011   38.85111099 -122.593333
39.141877   -123.044724 706777142   60012   39.22794396 -123.064722
38.928113   -122.611386 708644013   60016   38.98950003 -122.7695828
39.02361    -122.72195  708582623   60016   38.98950003 -122.7695828
38.87586    -122.842684 708336092   60016   38.98950003 -122.7695828
39.239926   -123.145497 709020144   60017   39.24138798 -123.2163878
39.3307 -123.221674 708875205   60017   39.24138798 -123.2163878", header = TRUE)

代码

我想创建一个空间线对象,可以使用addPolylines在leaflet中绘制。

首先,我想创建一个仅包含纬度/经度的数据框,并为每个事件位置组合分配唯一的id

library(tidyverse)
#craete a column with unique id's per event-location combination
df <- df %>% mutate( id = row_number() )
#create a temporaty df with events
events.df <- df %>% 
  select( id, Event_lat, Event_lon) %>% 
  rename( latitude = Event_lat, longitude = Event_lon)
#create a temporaty df with locations
locations.df <- df %>% 
  select( id, Location_latitude, Location_longitude) %>%
  rename( latitude = Location_latitude, longitude = Location_longitude)
#merge the two temp.df's together
df.sp <- bind_rows( events.df, locations.df )

#    id latitude longitude
# 1   1 40.79115 -124.0540
# 2   2 38.90088 -122.6604
# 3   3 38.92149 -122.6000
# 4   4 38.92149 -122.6000
# 5   5 39.14188 -123.0447
# 6   6 38.92811 -122.6114
# 7   7 39.02361 -122.7220
# 8   8 38.87586 -122.8427
# 9   9 39.23993 -123.1455
# 10 10 39.33070 -123.2217
# 11  1 40.79096 -124.1826
# 12  2 38.87389 -122.7097
# 13  3 38.85111 -122.5933
# 14  4 38.85111 -122.5933
# 15  5 39.22794 -123.0647
# 16  6 38.98950 -122.7696
# 17  7 38.98950 -122.7696
# 18  8 38.98950 -122.7696
# 19  9 39.24139 -123.2164
# 20 10 39.24139 -123.2164

现在需要创建 spatialLines 对象。
library(maptools)
library(sp)
#make df.sp a spatialdataframe
coordinates( df.sp ) <- c( "longitude", "latitude" )

#create a list per id
id.list <- sp::split( df.sp, df.sp[["id"]] )

#initialisation of counter
id <- 1

#for each id, create a line that connects all points with that id
for ( i in id.list ) {
  event.lines <- SpatialLines( list( Lines( Line( i[1]@coords ), ID = id ) ),
                               proj4string = CRS( "+init=epsg:4326" ) )
  if ( id == 1 ) {
    sp_lines  <- event.lines
  } else {
    sp_lines  <- spRbind( sp_lines, event.lines )
  }
  id <- id + 1
}

检查。

head(sp_lines,1)

# An object of class "SpatialLines"
# Slot "lines":
#   [[1]]
# An object of class "Lines"
# Slot "Lines":
#   [[1]]
# An object of class "Line"
# Slot "coords":
#   longitude latitude
# [1,] -124.0540 40.79115
# [2,] -124.1826 40.79096
# 
# Slot "ID":
#   [1] "1"
# 
# Slot "bbox":
#   min        max
# x -124.18256 -124.05401
# y   40.79096   40.79115
# 
# Slot "proj4string":
#   CRS arguments:
#   +init=epsg:4326 +proj=longlat +datum=WGS84 +no_defs +ellps=WGS84 +towgs84=0,0,0 

现在,在leaflet中绘制点和折线。
library(leaflet)
leaflet()%>%
  addTiles() %>%
  addCircles(df,lng = df$Event_lon, lat = df$Event_lat, radius=20, color = "red", group = "events") %>% 
  addCircles(df,lng = df$Location_longitude, lat = df$Location_latitude, radius=20, color = "blue", group = 'Locations') %>%
  addPolylines( data = sp_lines )

谢谢!我不确定这是否是最有效的方法,但它能够工作,这比效率更重要。 - David Wilkes
另外一个好的解决方案。我建议转向 sf,因为这是作者的重点和开发方向(两个软件包都是同一个人开发的)。 - SymbolixAU

网页内容由stack overflow 提供, 点击上面的
可以查看英文原文,
原文链接