如何在leaflet中两个标记之间添加路线(折线)

4
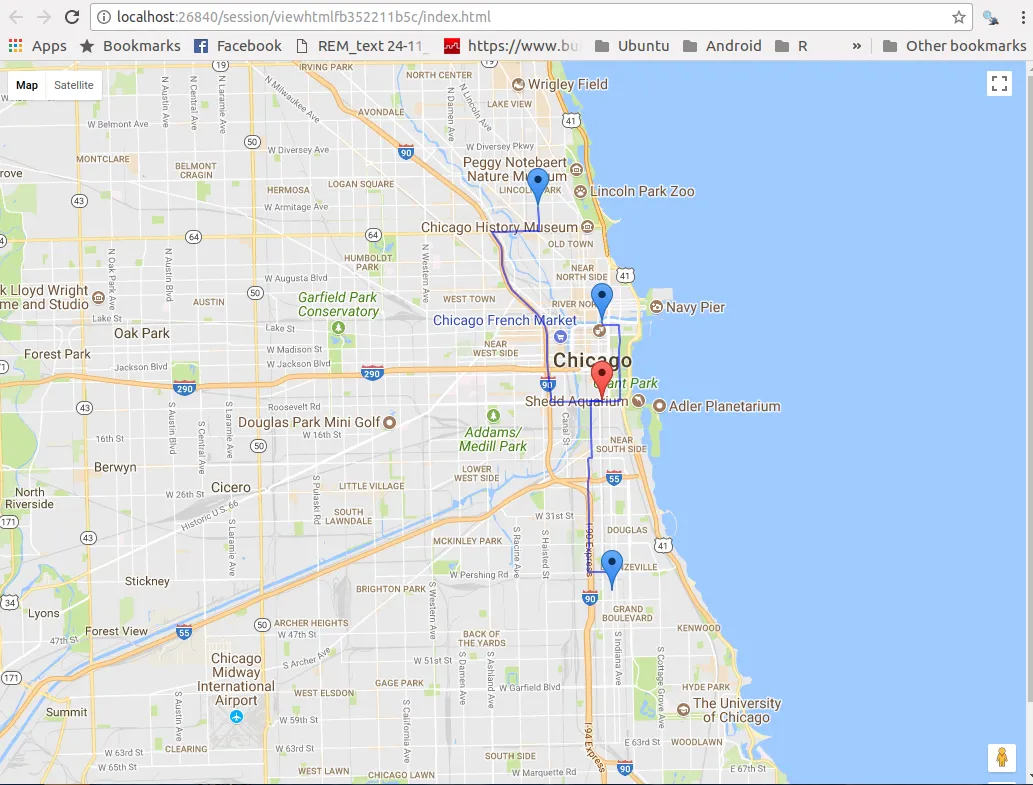
我想在这两个点之间添加折线。我该怎么做?
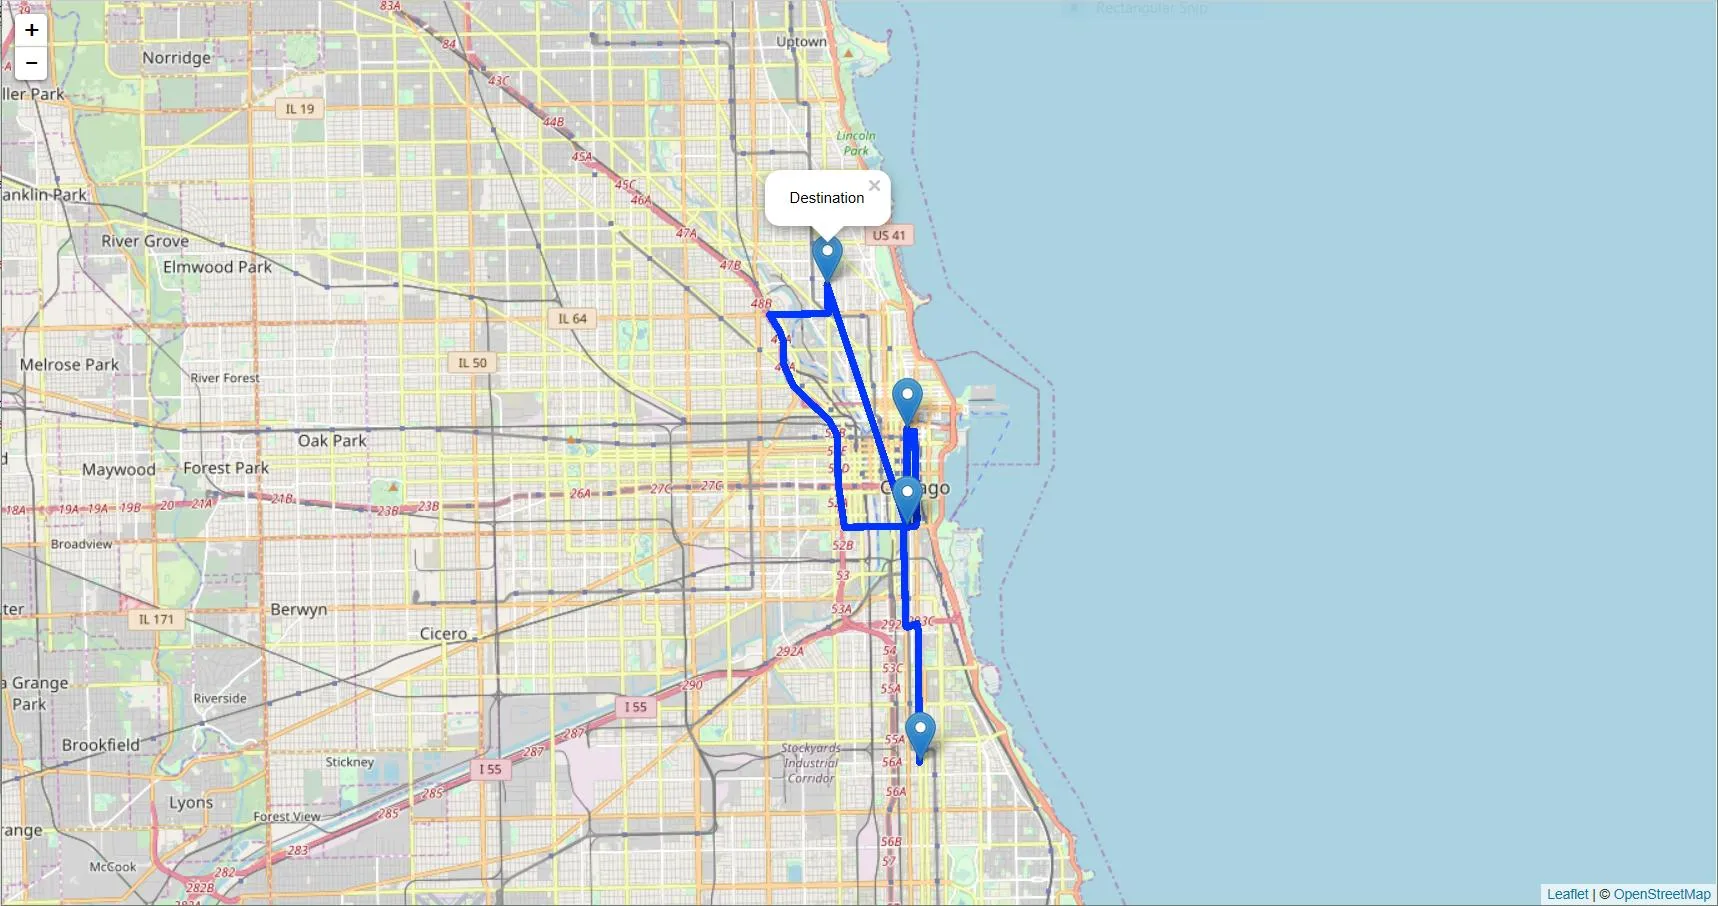
m <- leaflet() %>%
     addPolylines() %>%
     addTiles() %>%  # Add default OpenStreetMap map tiles
     addMarkers(lng = -87.6266382, lat = 41.8674336,
                popup = "starting") %>%
     addMarkers(lng = -87.64847, lat = 41.9168862,
                popup = "Destination")

m  # Print the map

数据示例。

| region      | from_lat   | from_long    | to_lat      | to_long    |
|-------------|------------|------------- |-------------|----------- |
| 1           | 41.8674336 | -87.6266382  | 41.887544   | -87.626487 |
| 2           | 41.8674336 | -87.6266382  | 41.9168862  | -87.64847  |
| 3           | 41.8674336 | -87.6266382  | 41.8190937  | -87.6230967|

@jazzurro 是的,我也看到了。但是我希望得到像 GPS 一样的路线,但是是在两个标记之间,而不是显示直线。这是可能的吗?还是我问错了问题? - Ewson Phang
我认为您想要检查googleway软件包。 - jazzurro
https://rdrr.io/cran/googleway/man/add_polylines.html 是类似这样的东西吗? - Ewson Phang
2个回答

2

@jazzurro的回答非常准确,应该保留为被接受的答案。

正如他们所提到的,如果您想要在Google地图上绘制,可以在googleway包内完成所有操作。与使用leaflet的主要区别在于,您不需要解码polyline,Google地图可以为您处理编码字符串。

polylines <- lapply(1:nrow(mydf), function(x){

  foo <- google_directions(origin = unlist(mydf[x, 2:3]),
                           destination = unlist(mydf[x, 4:5]),
                           key = apiKey,
                           mode = "driving",
                           simplify = TRUE)

  ## no need to decode the line, just return the string as-is
  foo$routes$overview_polyline$points
}
)

df <- data.frame(polylines = unlist(polylines), stringsAsFactors = F)

## add some colour values for the markers
mydf$colour_from <- "red"
mydf$colour_to <- "blue"

## plot the polylines and the markers
google_map(key = mapKey) %>%
  add_markers(data = mydf, lat = "from_lat", lon = "from_long", colour = "colour_from") %>%
  add_markers(data = mydf, lat = "to_lat", lon = "to_long", colour = "colour_to") %>%
  add_polylines(data = df, polyline = "polylines")

输入图像描述


注意: 我是googleway的作者。


这段文字与IT技术无关。

很高兴你找到了这个问题。我想你会看一下是否有gooleway标签。 :) 所以我把它加到了问题中。我只是想确认我们需要为每个循环遍历goole_directions()。对吗?或者我们可以一次性转储多条路线,避免使用lapply吗? - jazzurro
@jazzurro - 这是一个好问题,我已经尝试找到一种适合避免循环的方法。然而,由于google_* api调用一次只能处理一个,我还没有找到解决办法。如果您有任何建议,我很乐意听取。此外,在开发版本中,我一直在添加方法以使提取结果更容易 - SymbolixAU
如果有这样的限制,我们只能遵循谷歌的说法。当我编写上面的代码时,我对这一点不是很确定。如果您的CRAN手册或vignette中有这个规定,那就太好了。然后,您的软件包用户将知道他们必须通过循环获取多条路线的数据。看到他/她在上面的评论中的代码,OP似乎对这一点感到困惑。至于提取结果的方式,我认为那看起来非常好。direction_polyline <- function(res) .access_result(resultType(res), "polyline")返回一个带有经度和纬度的数据框吗? - jazzurro
@jazzurro - 感谢您的建议;我已将其添加到下一个里程碑中(https://github.com/SymbolixAU/googleway/issues/101)。`direction_polyline`函数只会返回编码的折线,而不会对其进行解码。我在[我的博客](https://www.symbolix.com.au/blog-main/fhcs36y9h8zftenfhwpsredbeyf3zf)上给出了一个快速示例。 - SymbolixAU
在绘图方面,我之前无法想到任何完成此任务的方法。但是你提供的函数确实帮助我获取绘制ggplot图形所需的路线数据。 - jazzurro
显示剩余3条评论

1
这是我的尝试。由于您想在leaflet地图上绘制一些路线,因此希望通过googleway包实现此任务。它允许您使用google_directions()decode_pl()提取路线数据。由于您有多条路线,因此要使用lapply()创建数据集。一旦您拥有路线数据,您的工作就很简单;您可以在addPolylines()中使用数据。
library(dplyr)
library(googleway)
library(leaflet)

mydf <- data.frame(region = 1:3,
                   from_lat = 41.8674336,
                   from_long = -87.6266382,
                   to_lat = c(41.887544, 41.9168862, 41.8190937),
                   to_long = c(-87.626487, -87.64847, -87.6230967))

mykey <- "you need to have your API key here"

lapply(1:nrow(mydf), function(x){

    foo <- google_directions(origin = unlist(mydf[x, 2:3]),
                             destination = unlist(mydf[x, 4:5]),
                             key = mykey,
                             mode = "driving",
                             simplify = TRUE)

    pl <- decode_pl(foo$routes$overview_polyline$points)

    return(pl)

        }
    ) %>%
bind_rows(.id = "region") -> temp


m <- leaflet() %>%
     addProviderTiles("OpenStreetMap.Mapnik") %>%
     addPolylines(data = temp, lng = ~lon, lat = ~lat, group = ~region) %>%
     addMarkers(lng = -87.6266382, lat = 41.8674336,
                popup = "starting")%>%
     addMarkers(data = mydf, lng = ~to_long, lat = ~to_lat,
                popup = "Destination")

enter image description here


我可以再问一个问题吗?您提到使用google_directions()和decode_pl(),可以提取路线数据。我该如何实现呢?是通过使用as.numeric(foo)和as.numeric(pl)吗?如果我的问题很傻,请见谅,我是R的新手,特别是对于谷歌地图。 - Ewson Phang
@EwsonPhang 请看一下这个链接:https://cran.r-project.org/web/packages/googleway/vignettes/googleway-vignette.html - jazzurro
@EwsonPhang 看看这个包。你可能能够用这个包完成你的任务。这个包的作者在SO上。如果你联系到他/她,你会得到更多信息。 - jazzurro
fun_check_location(loc [[x]], type) 中的错误: 目的地元素必须是经/纬度坐标的数字向量,或者是地址字符串。 - Ewson Phang
df <- google_distance(origins = list(c(41.8674336,-87.6266382), c(41.887544, -87.626487), c(-37.81659, 144.9841)), destinations = c(41.9168862 -87.64847), key = mykey)df <- google_distance(origins = list(c(41.8674336,-87.6266382),                              c(41.887544,-87.626487),                              c(-37.81659,144.9841)),                         destinations = c(41.9168862 -87.64847),                         key = mykey) - Ewson Phang
@EwsonPhang 你得学会如何使用这个函数。我建议你花些时间去学习你在使用函数时在做什么。 - jazzurro

网页内容由stack overflow 提供, 点击上面的
可以查看英文原文,
原文链接