这可能是一个bug吗?当我使用describe()或std()函数对groupby对象进行操作时,得到的结果不同
import pandas as pd
import numpy as np
import random as rnd
df = pd.DataFrame({'A' : ['foo', 'bar', 'foo', 'bar',
...: 'foo', 'bar', 'foo', 'foo'],
...: 'B' : ['one', 'one', 'two', 'three',
...: 'two', 'two', 'one', 'three'],
...: 'C' : 1*(np.random.randn(8)>0.5),
...: 'D' : np.random.randn(8)})
df.head()
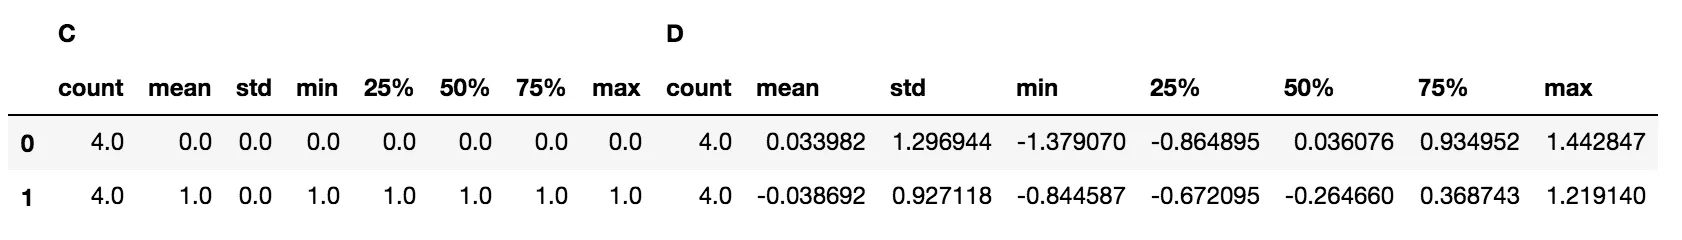
df[['C','D']].groupby(['C'],as_index=False).describe()
# this line gives me the standard deviation of 'C' to be 0,0. Within each group value of C is constant, so that makes sense.
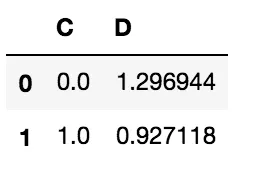
df[['C','D']].groupby(['C'],as_index=False).std()
# This line gives me the standard deviation of 'C' to be 0,1. I think this is wrong