如果满足条件,使用Python绘制x-y数据图表

12

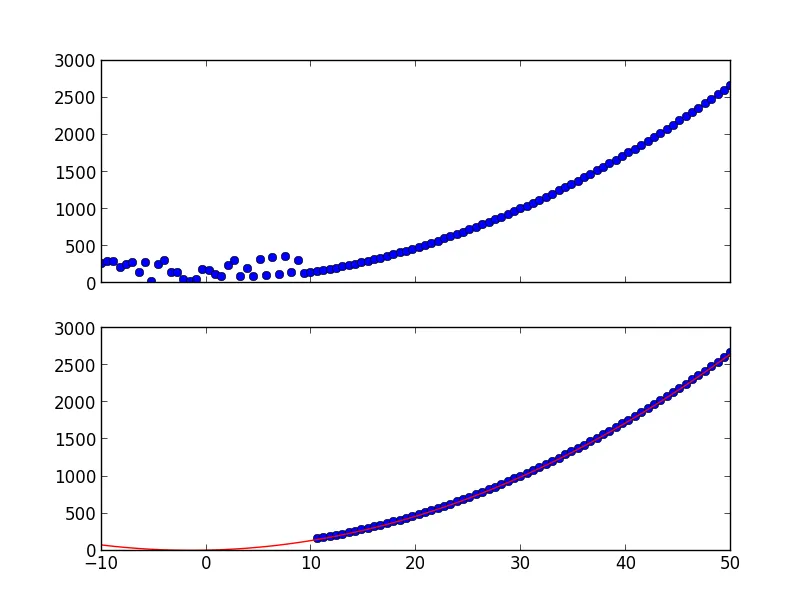
我希望能够对x-y数据进行绘制/拟合,前提是数据集的x值符合某个条件(即大于10)。

我的尝试:

x_values, y_values = loadtxt(fname, unpack=True, usecols=[1, 0])

for x in x_values:
    if x > 10:
        (m,b)=polyfit(x_values,y_values,1)
        yp = polyval([m,b],x_values)
        plot(x_values,yp)
        scatter(x_values,y_values)
    else:
        pass
也许最好删除x值条件不满足的行的x-y条目,然后绘制/拟合?
1个回答

22

当然,只需使用布尔索引即可。您可以执行像y = y[x > 10]这样的操作。

例如:

import numpy as np
import matplotlib.pyplot as plt

#-- Generate some data...-------
x = np.linspace(-10, 50, 100)
y = x**2 + 3*x + 8

# Add a lot of noise to part of the data...
y[x < 10] += np.random.random(sum(x < 10)) * 300

# Now let's extract only the part of the data we're interested in...
x_filt = x[x > 10]
y_filt = y[x > 10]

# And fit a line to only that portion of the data.
model = np.polyfit(x_filt, y_filt, 2)

# And plot things up
fig, axes = plt.subplots(nrows=2, sharex=True)
axes[0].plot(x, y, 'bo')
axes[1].plot(x_filt, y_filt, 'bo')
axes[1].plot(x, np.polyval(model, x), 'r-')

plt.show()

在此输入图片描述


能否进行多条件过滤?例如:x_filt = x[x<100, x<50] - 8765674
4
好的!只需用括号和 &| 表示“或”来组合它们(由于某些原因,andor 不起作用,我将在此跳过解释)。例如:x_filt = x[(x < 100) & (x < 50)] - Joe Kington
有没有一种方法可以像这样实现:maxY = Y[max[Y]]xAtMaxY = X[max[Y]] - 8765674
请查看 argmax http://docs.scipy.org/doc/numpy/reference/generated/numpy.argmax.html 另外,对于多维数组,您可能想要执行 x[y == y.max()] - Joe Kington
使用这个方法,我得到了“设置数组元素为序列”的错误。我该如何将其转换为浮点数? - 8765674

网页内容由stack overflow 提供, 点击上面的
可以查看英文原文,
原文链接