这段内容是关于IT技术的修改版示例,原始示例可以在这里找到:
import io
import pandas as pd
import matplotlib.pyplot as plt
data = io.StringIO('''\
Values
1992-08-27 07:46:48,1
1992-08-27 08:00:48,2
1992-08-27 08:33:48,4
1992-08-27 08:43:48,3
1992-08-27 08:48:48,1
1992-08-27 08:51:48,5
1992-08-27 08:53:48,4
1992-08-27 08:56:48,2
1992-08-27 09:03:48,1
''')
s = pd.read_csv(data, squeeze=True)
s.index = pd.to_datetime(s.index)
res = s.resample('4s').interpolate('linear')
print(res)
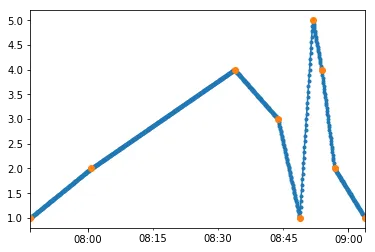
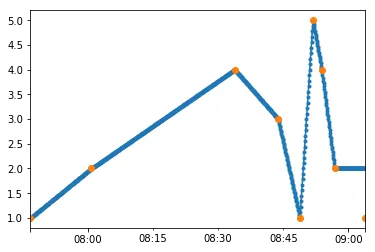
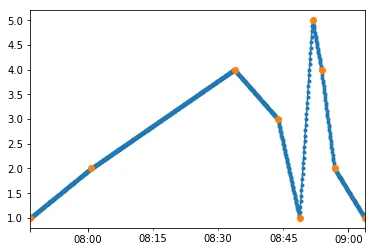
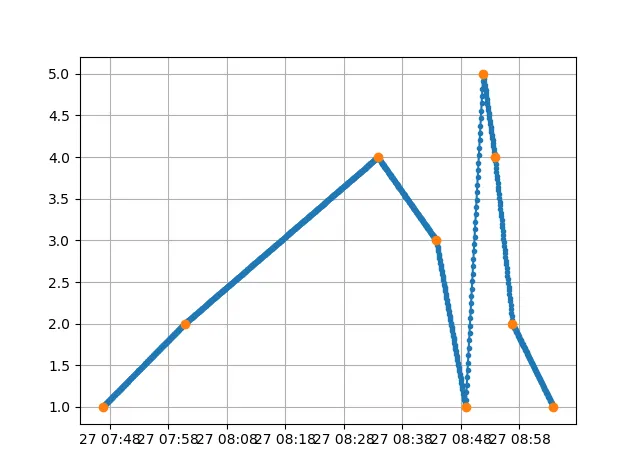
plt.plot(res, '.-')
plt.plot(s, 'o')
plt.grid(True)
它的表现符合预期:
1992-08-27 07:46:48    1.000000
1992-08-27 07:46:52    1.004762
1992-08-27 07:46:56    1.009524
1992-08-27 07:47:00    1.014286
1992-08-27 07:47:04    1.019048
1992-08-27 07:47:08    1.023810
1992-08-27 07:47:12    1.028571
....
但如果我将重采样更改为'5s',它只会生成NaN:
1992-08-27 07:46:45   NaN
1992-08-27 07:46:50   NaN
1992-08-27 07:46:55   NaN
1992-08-27 07:47:00   NaN
1992-08-27 07:47:05   NaN
1992-08-27 07:47:10   NaN
1992-08-27 07:47:15   NaN
....
为什么?