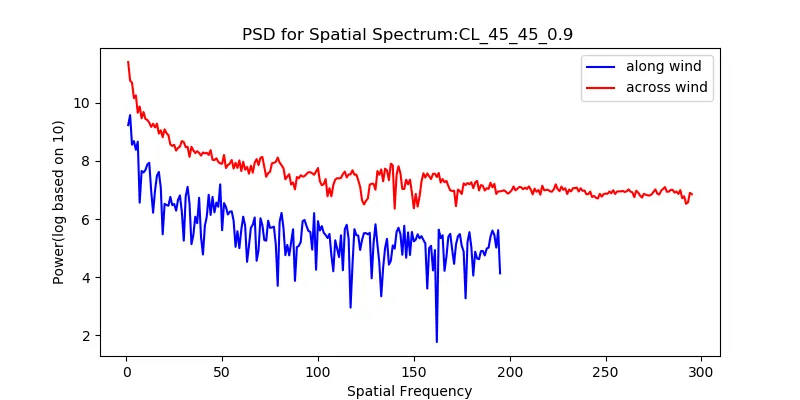
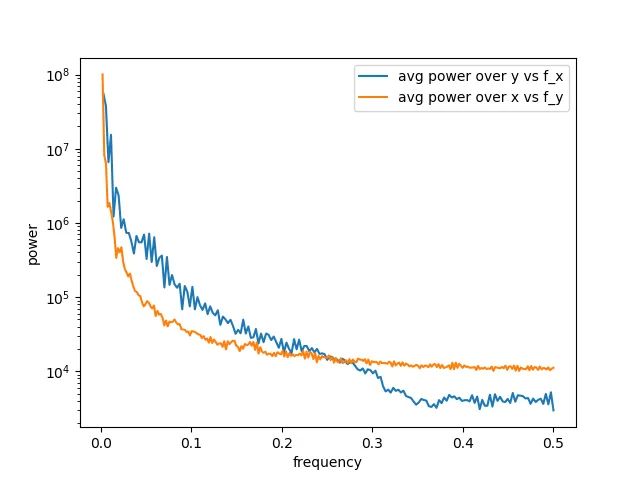
一位研究教授要求我为几个视频生成2D空间频谱密度图。 我有两个问题:
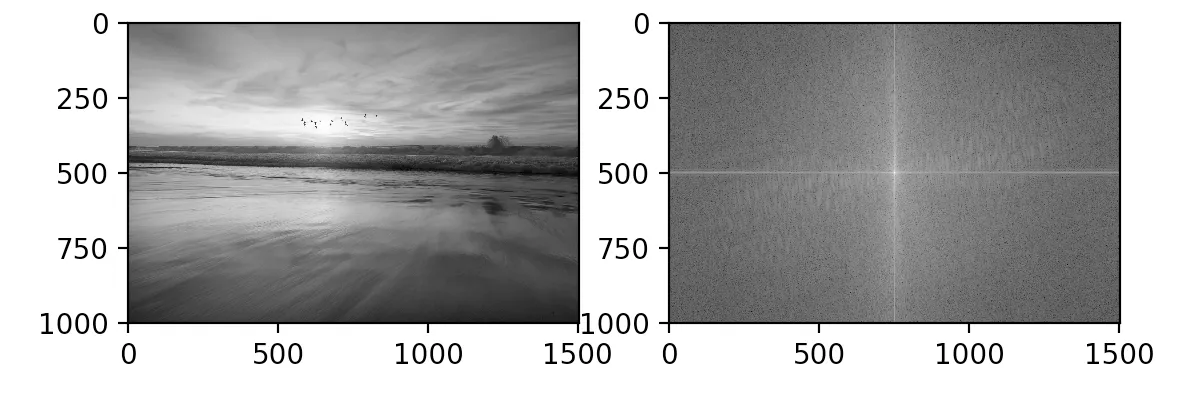
这将生成类似于这样的内容:
- 如何绘制PSD vs x、y轴?
- 我知道如何为图像生成PSD,但不确定如何在视频中执行相同操作。 我想对视频中的每个帧获取PSD并取平均值,但我在Python中实现时遇到了困难。
curr_dir = os.getcwd()
img = cv2.imread(curr_dir+'/test.jpg',0)
f = np.fft.fft2(img)
fshift = np.fft.fftshift(f)
mag = 20*np.log(np.abs(fshift))
plt.subplot(121), plt.imshow(img,cmap='gray')
plt.subplot(122), plt.imshow(mag,cmap='gray')
plt.show()
这将生成类似于这样的内容: