背景
在阅读了如何扩展ggplot的精彩回答和相应的文献之后,我试图理解如何扩展 ggplot 。
简言之
我明白这些部分是如何组合在一起的,但我缺少重要信息: ggplot 如何确定轴的默认范围?
代码
考虑以下玩具示例:
library(grid)
library(ggplot2)

GeomFit <- ggproto("GeomFit", GeomBar,
                   required_aes = c("x", "y"),
                   setup_data = .subset2(GeomBar, "setup_data"),
                   draw_panel = function(self, data, panel_scales, coord, width = NULL) {
                     bars <- ggproto_parent(GeomBar, self)$draw_panel(data,
                                                                      panel_scales,
                                                                      coord)
                     coords <- coord$transform(data, panel_scales)
                     tg <- textGrob("test", coords$x, coords$y * 2 - coords$ymin)
                     grobTree(bars, tg)
                   }
)

geom_fit <- function(mapping = NULL, data = NULL,
                     stat = "count", position = "stack",
                     ...,
                     width = NULL,
                     binwidth = NULL,
                     na.rm = FALSE,
                     show.legend = NA,
                     inherit.aes = TRUE) {

  layer(
    data = data,
    mapping = mapping,
    stat = stat,
    geom = GeomFit,
    position = position,
    show.legend = show.legend,
    inherit.aes = inherit.aes,
    params = list(
      width = width,
      na.rm = na.rm,
      ...
    )
  )
}

set.seed(1234567)
data_gd <- data.frame(x = letters[1:5],
                      y = 1:5)

p <- ggplot(data = data_gd, aes(x = x, y = y, fill = x)) +
  geom_fit(stat = "identity")
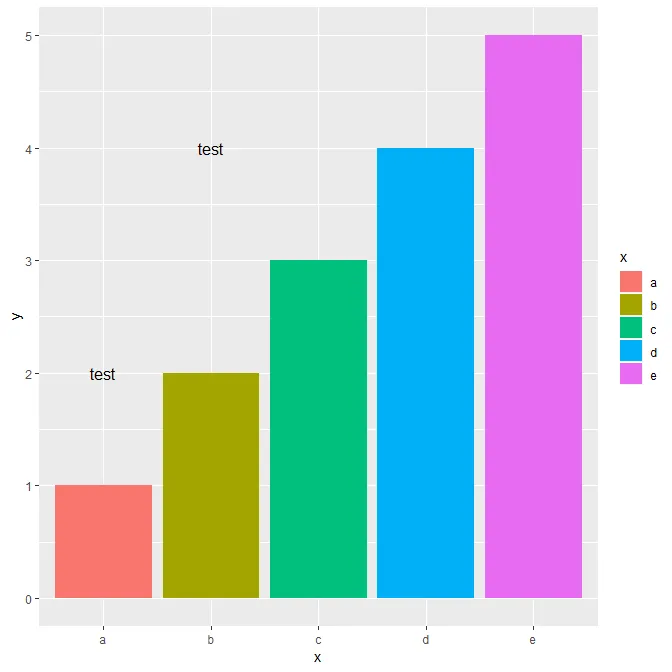
这会产生以下图表:
问题
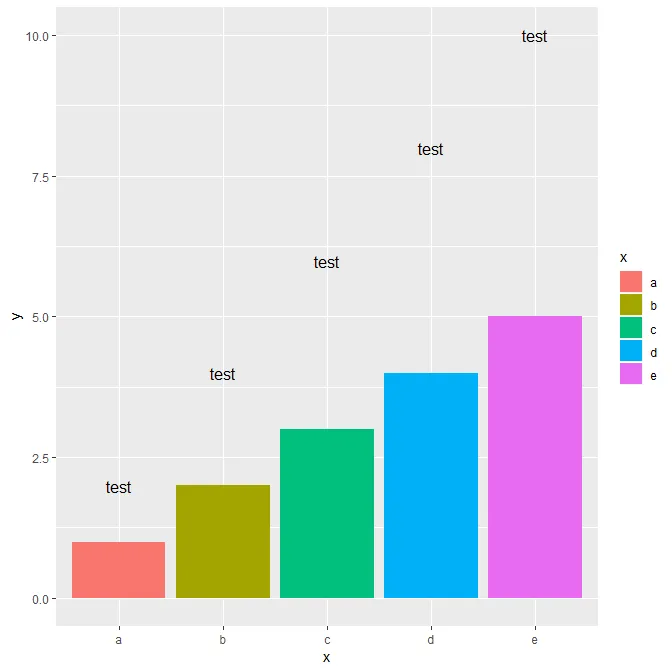
如您所见,一些文本未显示。我认为ggplot在计算轴范围时并不知道需要额外的空间来放置我的textGrob。我该如何解决?(期望的结果相当于p+expand_limits(y=10))。
NB. 当然,我可以将问题推给最终用户,要求他们添加手动比例尺。但理想情况下,我希望比例尺能够正确设置。
ggplot通过乘法和加法扩展数据范围。用户可以在scale函数的expand参数中设置多个和添加因子。这里有一个例子。当人们希望图形不被扩展时,这经常出现。在最近的版本中,您可以使用expand_scale仅在一个方向上扩展轴。?expand_scale是一个不错的起点。 - Gregor Thomaslayer_data(p),则y值的范围为1-5,因此这就是图形的比例范围。 - Z.Linggplot如何知道它需要查找哪个范围?使用相同的数据,基于我的映射,我可以得到非常不同的范围:d <- data.frame(x = rep(1:10, 10), y = sample(3, 100, TRUE)):p <- ggplot(d, aes(x = x)); p + geom_bar()vsp + geom_bar(aes(y=y), stat = "identity")。因此,只有在我们知道在geom中使用哪些映射之后,我们才能确定绘图的范围。-> 1. 哪个函数负责确定范围?2. 从哪个函数调用他的函数? - thothaltrain_position函数。当我挖掘 ggplot 对象时,我喜欢使用的一个技巧是在ggplot2:::ggplot_build.ggplot或ggplot2:::ggplot_gtable.ggplot_built(也就是ggplotGrob()的两个阶段) 中运行调试,并检查每个步骤的输出,以找到感兴趣的现象 (在这种情况下是比例尺创建) 发生的位置。不过要小心,兔子洞可能会变得非常非常深... - Z.LinGeom*内部函数上使用debug了。我想我找到了一个丑陋的解决方法,我会将其发布供以后参考。 - thothal