如何从gnuplot中的数据设置点类型?
gnuplot脚本:
如何从三列中获取点类型?
gnuplot脚本:
set terminal pngcairo size 640,480
set output "points.png"
set style data points
set auto x
set autoscale x
unset colorbox
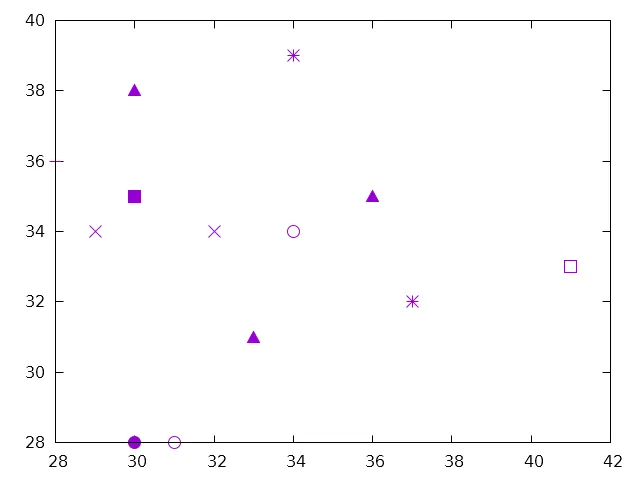
plot 'test.data' using 2:1 with points notitle
test.data
32  35  8
34  34  6
36  28  1
34  32  2
28  30  7
38  30  9
34  29  2
35  36  9
39  34  3
31  33  9
28  31  6
35  30  5
33  41  4
32  37  3
如何从三列中获取点类型?
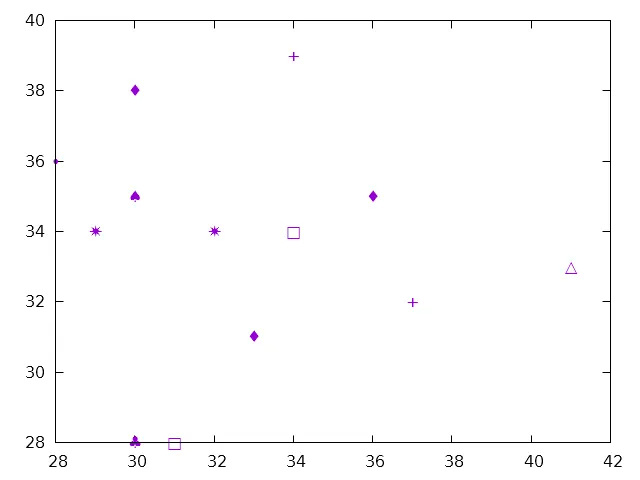
plot 'gnuplot.data' using 2:1 with points pt (:3) notitle // error
抽象化示例:
需求:
gnuplot版本4.6修补程序4