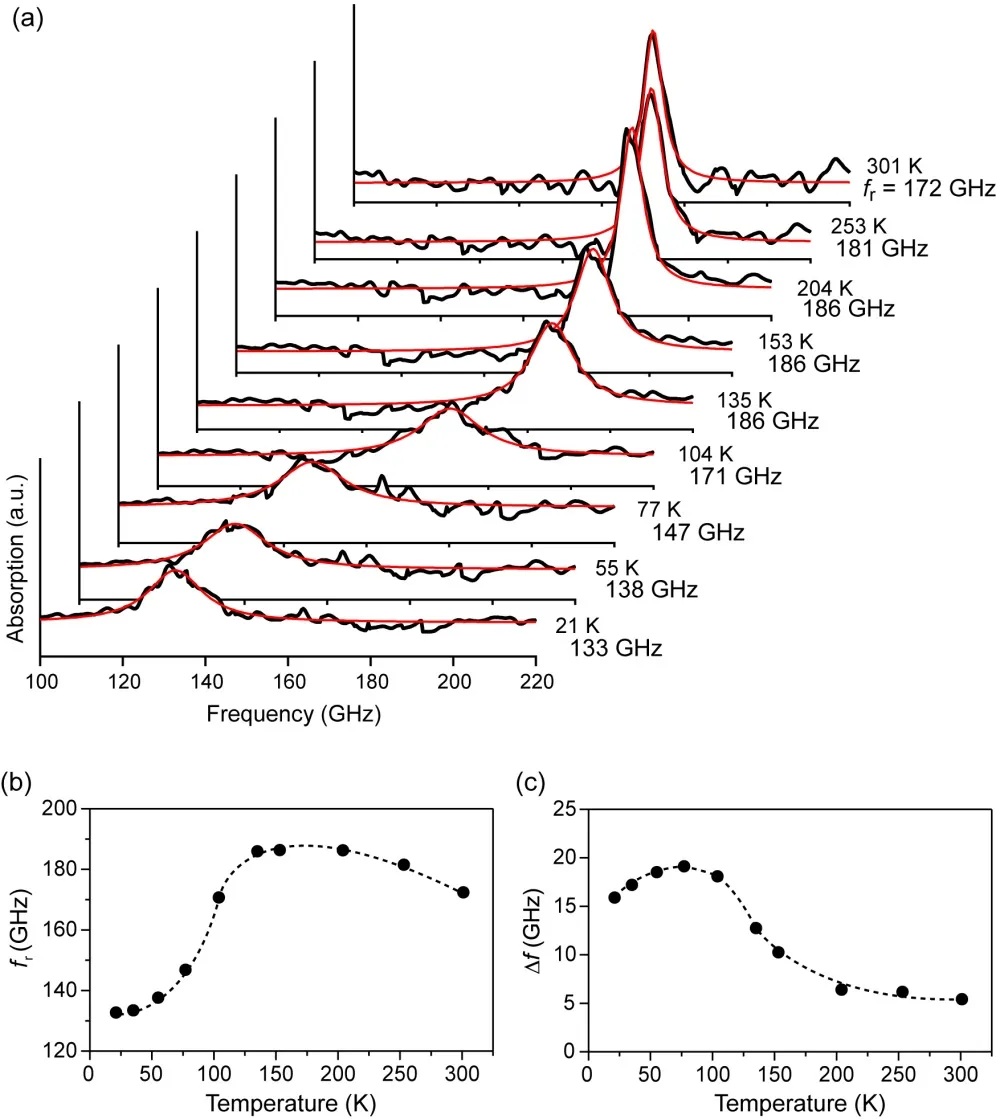
我从未见过像图(a)一样的情节,它是否可能存在?
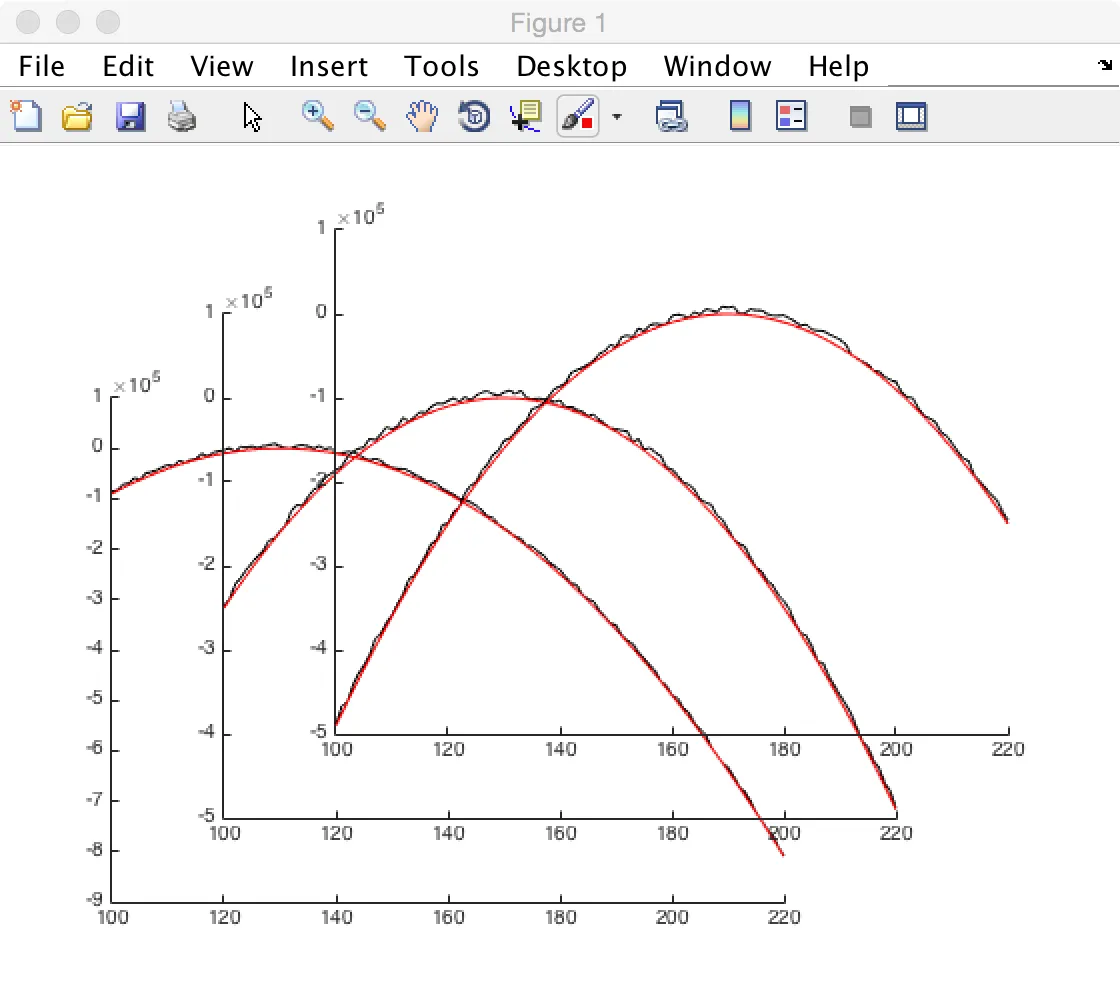
axes命令知识 - 其余只是微调让它看起来好看。让我们来看看:t = 100:220;
x1 = -(10*(t-130)).^2;
x2 = -(10*(t-150)).^2;
x3 = -(10*(t-170)).^2;
fig = figure(1);
set(fig,'Color','w');
x1绘制在上面:ax(1) = axes('Position',[0.1,0.1,0.6,0.6]);
plot(ax(1),t,x1+10^4*rand(size(x1)),'-k',t,x1,'-r');
我们将删除坐标轴周围的框,只保留x轴和y轴。此外,我们调整图表大小,以便有足够的空间容纳其他两个图表。我们还将颜色设置为none(即透明)。
set(ax(1),'Color','none');
set(ax(1),'Box','off');
set(ax(1),'Position',[0.1,0.1,0.6,0.6]);
ax(2) = axes('Position',[0.2,0.2,0.6,0.6]);
plot(ax(2),t,x2+10^4*rand(size(x2)),'-k',t,x2,'-r');
set(ax(2),'Color','none');
set(ax(2),'Box','off');
以及其他类似的内容:
ax(3) = axes('Position',[0.3,0.3,0.6,0.6]);
plot(ax(3),t,x3+10^4*rand(size(x3)),'-k',t,x3,'-r');
set(ax(3),'Color','none');
set(ax(3),'Box','off');
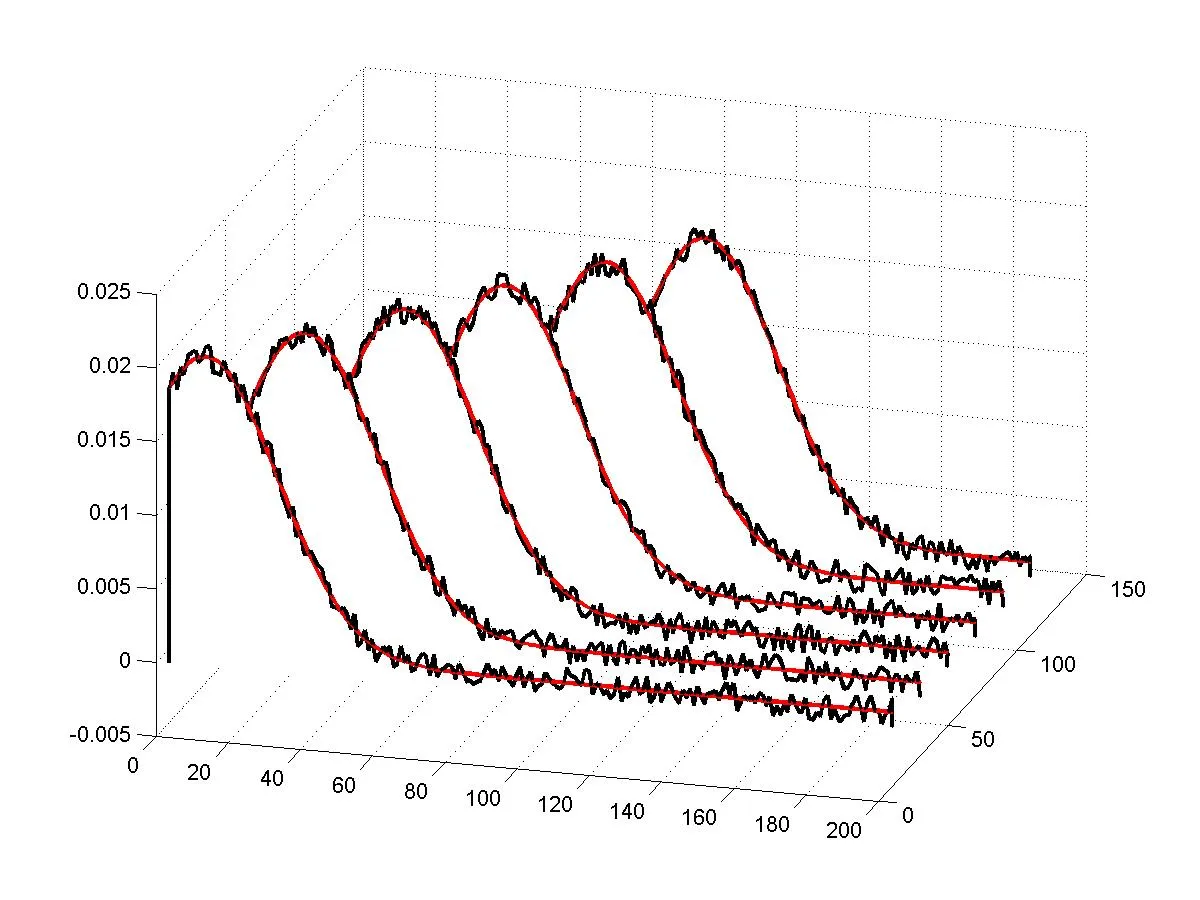
 %// create some sample data
t=10:20:110;
x=0:1:200;
Y=bsxfun(@(x,t) normpdf(x,t,20),x,t.');                                                         %//' fix the code formatting on SO!!

%// Make a colormap to to set the colour of the lines
colormap([1 0 0;0 0 0]);caxis=[0 1];

%// Plot the first set of lines (red ones)
h1=waterfall(x,t,Y,zeros(size(Y)));
set(h1,'FaceColor','none','LineWidth',2) %// tweak the properties
hold on

%// Plot the second set of lines (black lines), just the red lines with some noise
h2=waterfall(x,t,Y+0.002*(rand(size(Y))-0.5),ones(size(Y)));
set(h2,'LineWidth',2)
hold off

view([16 28])