更新:我在我的博客http://blog.rtwilson.com/producing-polar-contour-plots-with-matplotlib/上详细介绍了如何使用matplotlib绘制极坐标等高线图-您可能需要先去那里查看。
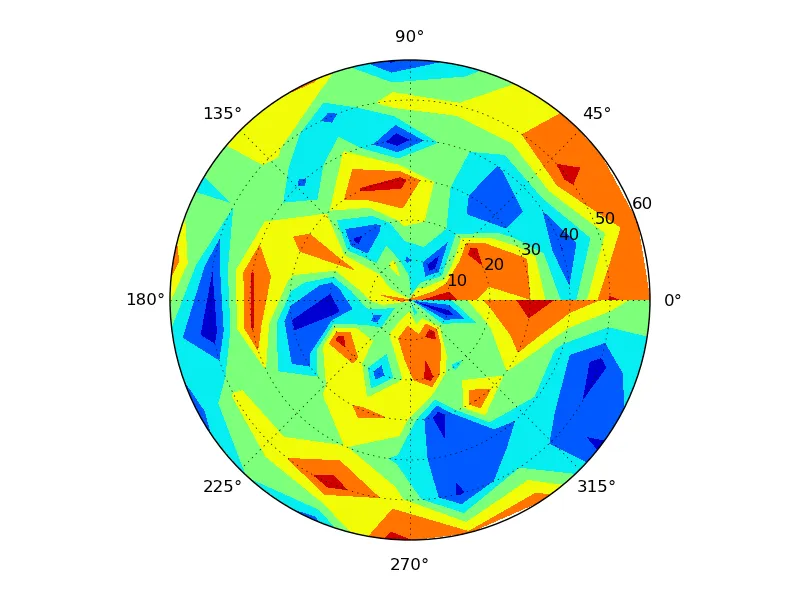
我正在尝试在matplotlib中绘制极坐标等高线图。我在互联网上找到了各种资源,但(a)我似乎无法让我的代码工作,(b)许多资源似乎相当古老,我想知道现在是否有更好的方法。例如,http://www.mail-archive.com/matplotlib-users@lists.sourceforge.net/msg01953.html建议很快会有改进,而那是在2006年!
我希望能够绘制适当的极坐标等高线图-就像pcolor允许您为其类型的图绘制一样(请参见下面的注释部分),但我似乎找不到任何方法来做到这一点,因此我首先将其转换为笛卡尔坐标。
无论如何,以下是我的代码:
from pylab import *
import numpy as np

azimuths = np.arange(0, 360, 10)
zeniths = np.arange(0, 70, 10)
values = []

for azimuth in azimuths:
  for zenith in zeniths:
    print "%i %i" % (azimuth, zenith)
    # Run some sort of model and get some output
    # We'll just use rand for this example
    values.append(rand())

theta = np.radians(azimuths)

values = np.array(values)
values = values.reshape(len(zeniths), len(azimuths))

# This (from http://old.nabble.com/2D-polar-surface-plot-td28896848.html)
# works fine
##############
# Create a polar axes
# ax = subplot(111, projection='polar')
# pcolor plot onto it
# c = ax.pcolor(theta, zeniths, values)
# show()

r, t = np.meshgrid(zeniths, azimuths)

x = r*np.cos(t)
y = r*np.sin(t)

contour(x, y, values)
当我运行它时,出现错误
TypeError: Inputs x and y must be 1D or 2D.。我不确定为什么会这样,因为x和y都是2D的。我做错了什么吗?此外,从模型返回值并将其放入列表然后重塑似乎相当笨拙。有更好的方法吗?
numpy.fromiter,如果遇到内存问题,它也很好用。至于嵌套的for循环,您可以使用itertools.product替换它们,但这在很大程度上取决于个人喜好。如果您可以将事情向量化以使用数组而不是单个值,则可能会看到加速。如果由于其他库而无法执行此操作,则无法执行。 - Joe Kingtonyield的函数)比编写更多“意大利面条式”的解决方案更加清晰。模块化更好 :) - Joe Kingtonax.colorbar()时,会出现错误AttributeError:'PolarAxesSubplot'对象没有属性'colorbar'。 - dylnan