我的Spark应用程序读取3个文件,大小分别为7MB、40MB、100MB,并进行多次转换并存储到多个目录中。
Spark版本为CDH1.5。
根据我的CDH
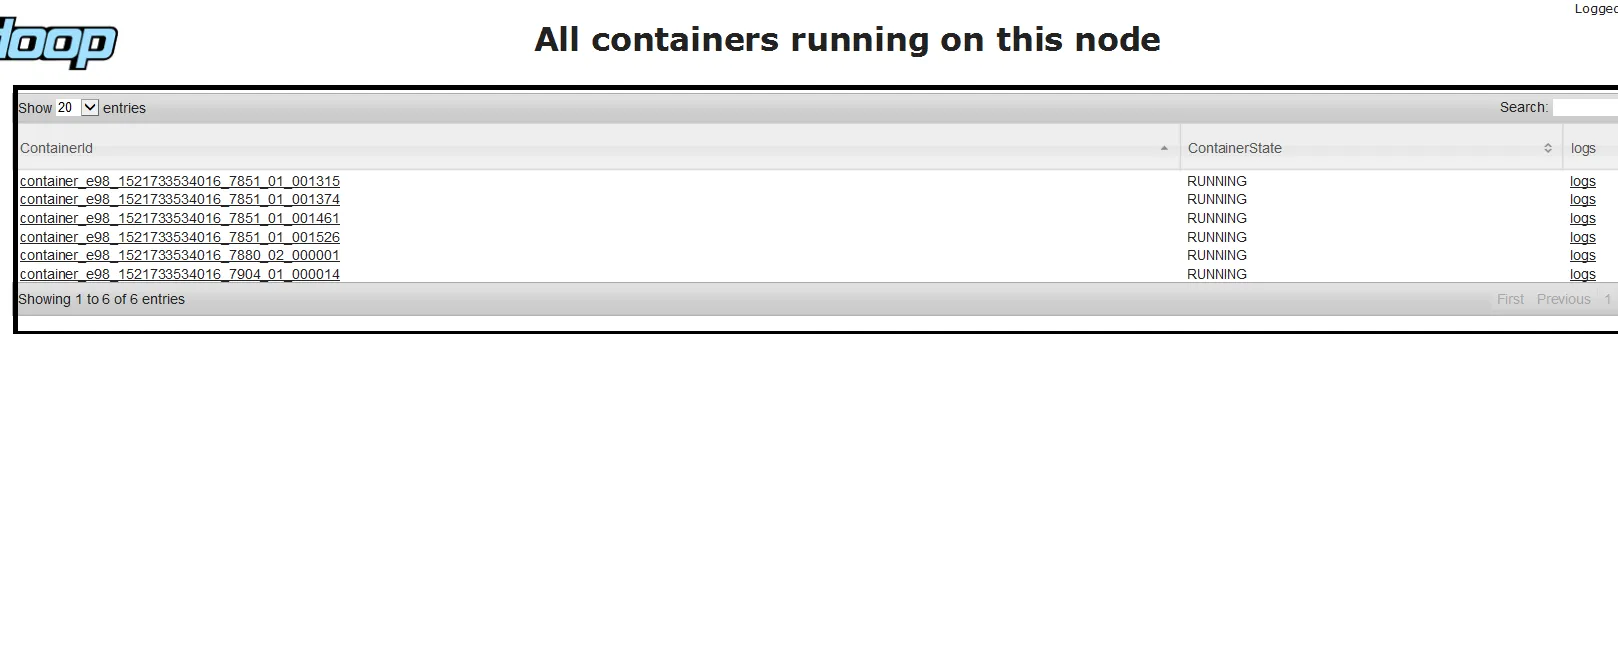
请看我的驱动节点上正在运行的容器。
这个错误是什么意思?它通常发生在什么情况下?
3.5 GB 物理内存中的 3.5 GB 是什么?是驱动器内存吗?
有人能帮我解决这个问题吗?
Spark版本为CDH1.5。
MASTER_URL=yarn-cluster
NUM_EXECUTORS=15
EXECUTOR_MEMORY=4G
EXECUTOR_CORES=6
DRIVER_MEMORY=3G
我的Spark作业运行了一段时间,然后抛出以下错误消息,并从头重新启动
18/03/27 18:59:44 INFO avro.AvroRelation: using snappy for Avro output
18/03/27 18:59:47 ERROR yarn.ApplicationMaster: RECEIVED SIGNAL 15: SIGTERM
18/03/27 18:59:47 INFO CuratorFrameworkSingleton: Closing ZooKeeper client.
再次重新启动后,运行了一段时间并出现了以下错误
Application application_1521733534016_7233 failed 2 times due to AM Container for appattempt_1521733534016_7233_000002 exited with exitCode: -104
For more detailed output, check application tracking page:http://entline.com:8088/proxy/application_1521733534016_7233/Then, click on links to logs of each attempt.
Diagnostics: Container [pid=52716,containerID=container_e98_1521733534016_7233_02_000001] is running beyond physical memory limits. Current usage: 3.5 GB of 3.5 GB physical memory used; 4.3 GB of 7.3 GB virtual memory used. Killing container.
Dump of the process-tree for container_e98_1521733534016_7233_02_000001 :
|- PID PPID PGRPID SESSID CMD_NAME USER_MODE_TIME(MILLIS) SYSTEM_TIME(MILLIS) VMEM_USAGE(BYTES) RSSMEM_USAGE(PAGES) FULL_CMD_LINE
|- 52720 52716 52716 52716 (java) 89736 8182 4495249408 923677 /usr/java/jdk1.7.0_67-cloudera/bin/java -server -Xmx3072m -Djava.io.tmpdir=/apps/hadoop/data04/yarn/nm/usercache/bdbuild/appcache/application_1521733534016_7233/container_e98_1521733534016_7233_02_000001/tmp -Dspark.yarn.app.container.log.dir=/var/log/hadoop-yarn/container/application_1521733534016_7233/container_e98_1521733534016_7233_02_000001 -XX:MaxPermSize=256m org.apache.spark.deploy.yarn.ApplicationMaster --class com.sky.ids.dovetail.asrun.etl.DovetailAsRunETLMain --jar file:/apps/projects/dovetail_asrun_etl/jars/EntLine-1.0-SNAPSHOT-jar-with-dependencies.jar --arg --app.conf.path --arg application.conf --arg --run_type --arg AUTO --arg --bus_date --arg 2018-03-27 --arg --code_base_id --arg EntLine-1.0-SNAPSHOT --executor-memory 4096m --executor-cores 6 --properties-file /apps/hadoop/data04/yarn/nm/usercache/bdbuild/appcache/application_1521733534016_7233/container_e98_1521733534016_7233_02_000001/__spark_conf__/__spark_conf__.properties
|- 52716 52714 52716 52716 (bash) 2 0 108998656 389 /bin/bash -c LD_LIBRARY_PATH=/opt/cloudera/parcels/CDH-5.5.1-1.cdh5.5.1.p0.11/lib/hadoop/../../../CDH-5.5.1-1.cdh5.5.1.p0.11/lib/hadoop/lib/native: /usr/java/jdk1.7.0_67-cloudera/bin/java -server -Xmx3072m -Djava.io.tmpdir=/apps/hadoop/data04/yarn/nm/usercache/bdbuild/appcache/application_1521733534016_7233/container_e98_1521733534016_7233_02_000001/tmp -Dspark.yarn.app.container.log.dir=/var/log/hadoop-yarn/container/application_1521733534016_7233/container_e98_1521733534016_7233_02_000001 -XX:MaxPermSize=256m org.apache.spark.deploy.yarn.ApplicationMaster --class 'com.sky.ids.dovetail.asrun.etl.DovetailAsRunETLMain' --jar file:/apps/projects/dovetail_asrun_etl/jars/EntLine-1.0-SNAPSHOT-jar-with-dependencies.jar --arg '--app.conf.path' --arg 'application.conf' --arg '--run_type' --arg 'AUTO' --arg '--bus_date' --arg '2018-03-27' --arg '--code_base_id' --arg 'EntLine-1.0-SNAPSHOT' --executor-memory 4096m --executor-cores 6 --properties-file /apps/hadoop/data04/yarn/nm/usercache/bdbuild/appcache/application_1521733534016_7233/container_e98_1521733534016_7233_02_000001/__spark_conf__/__spark_conf__.properties 1> /var/log/hadoop-yarn/container/application_1521733534016_7233/container_e98_1521733534016_7233_02_000001/stdout 2> /var/log/hadoop-yarn/container/application_1521733534016_7233/container_e98_1521733534016_7233_02_000001/stderr
Container killed on request. Exit code is 143
Container exited with a non-zero exit code 143
Failing this attempt. Failing the application.
根据我的CDH
 Container Memory[Amount of physical memory, in MiB, that can be allocated for containers]

 yarn.nodemanager.resource.memory-mb   50655 MiB
请看我的驱动节点上正在运行的容器。
这个错误是什么意思?它通常发生在什么情况下?
3.5 GB 物理内存中的 3.5 GB 是什么?是驱动器内存吗?
有人能帮我解决这个问题吗?