在Mathematica中,当我绘制图形时,有时候x轴并不总是与图形的底部完全对齐。有没有办法让它始终这样做?
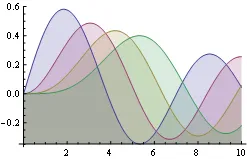
以下是我所说的示例:http://i.imgur.com/3lcWd.png 我希望x轴能够与底部的零刻度线完美对齐,而不是像该图像中那样在y轴的中间。
我有办法做到这一点吗?
以下是我所说的示例:http://i.imgur.com/3lcWd.png 我希望x轴能够与底部的零刻度线完美对齐,而不是像该图像中那样在y轴的中间。
我有办法做到这一点吗?
aPlot[f_, var_, opts : OptionsPattern[]] :=
 Plot[f, var,
  AxesOrigin ->
   First /@ (# /. AbsoluteOptions[Plot[f, var, opts], #] &@PlotRange), opts]

aPlot[Evaluate[Table[BesselJ[n, x], {n, 4}]], {x, 0, 10}, Filling -> Axis]
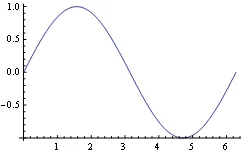
aPlot[Sin[x], {x, 0, 2 Pi}]
AxesOrigin -> {0, 0}来满足。很遗憾这样的东西还没有内置到Mathematica中。 - Mike BaileyAxesOrigin 是最好的选择! - Dr. belisariusFrame -> {{Automatic, None}, {Automatic, None}}
(另外,我认为它不默认选择{0,0}意味着y=0被PlotRangePadding带入了范围内。因此,这可能是另一个需要关注的选项。)这里是(在我看来)更优雅的方法,基于belisarius的代码,使用DisplayFunction选项(请参见此处关于该选项的有趣讨论):
Plot[Evaluate[Table[BesselJ[n, x], {n, 4}]], {x, 0, 10},
 Filling -> Axis,
 DisplayFunction ->
  Function[{plot},
   Show[plot,
    AxesOrigin ->
     First /@ (PlotRange /. AbsoluteOptions[plot, PlotRange]),
    DisplayFunction -> Identity]]]
AbsoluteOptions 并不总是给出正确的PlotRange值。解决方案是使用 Ticks 方法(它提供了完整的PlotRange,并添加了显式值PlotRangePadding):completePlotRange[plot_] :=
Last@Last@
Reap[Rasterize[
Show[plot, Ticks -> (Sow[{##}] &), DisplayFunction -> Identity],
ImageResolution -> 1]]
Plot[Evaluate[Table[BesselJ[n, x], {n, 4}]], {x, 0, 10},
Filling -> Axis,
DisplayFunction ->
Function[{plot},
Show[plot, AxesOrigin -> First /@ completePlotRange[plot],
DisplayFunction -> Identity]]]
Frame -> {{Automatic, None}, {Automatic, None}}, Axes -> False 完全相同。pl1 = Plot[Evaluate[Table[BesselJ[n, x], {n, 4}]], {x, 0, 10},
Filling -> Axis,
DisplayFunction ->
Function[{plot},
Show[plot, AxesOrigin -> First /@ completePlotRange[plot],
DisplayFunction -> Identity]]];
pl2 = Plot[Evaluate[Table[BesselJ[n, x], {n, 4}]], {x, 0, 10},
Filling -> Axis, Frame -> {{Automatic, None}, {Automatic, None}},
Axes -> False];
Rasterize[pl1] == Rasterize[pl1]
=> True