如何使用ggplot2包在地图上绘制经纬度点并使用不同颜色区分?

3

我有一个数据框包含变量名为ID、经度(LON)和纬度(LAT),你可以从这里下载。我使用以下代码使用ggplot2包在国家地图上绘制了一些经度-纬度,并使用相同的颜色:

library(ggplot2)
library(raster)
read.csv("station.csv")
skorea<- getData("GADM", country= "KOR", level=1)
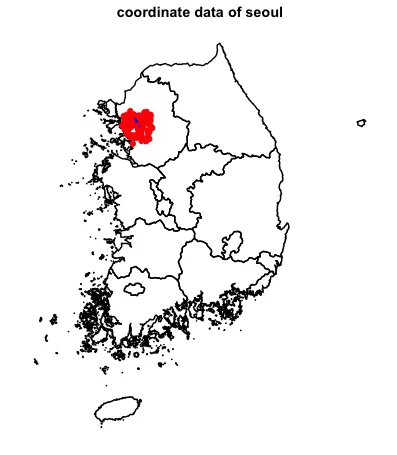
plot(skorea)
skorea<- fortify(skorea)

ggplot()+
  geom_map(data= skorea, map= skorea, aes(x=long,y=lat,map_id=id,group=group),
           fill=NA, colour="black") +
  geom_point(data=station, aes(x=LON, y=LAT), 
             colour= "red", alpha=1,na.rm=T) +
  scale_size(range=c(2,7))+
  labs(title= "coordinate data of seoul",
       x="Longitude", y= "Latitude")+
  theme(title= element_text(hjust = 0.5,vjust = 1,face= c("bold")))

我得到了以下的绘图结果: enter image description here 
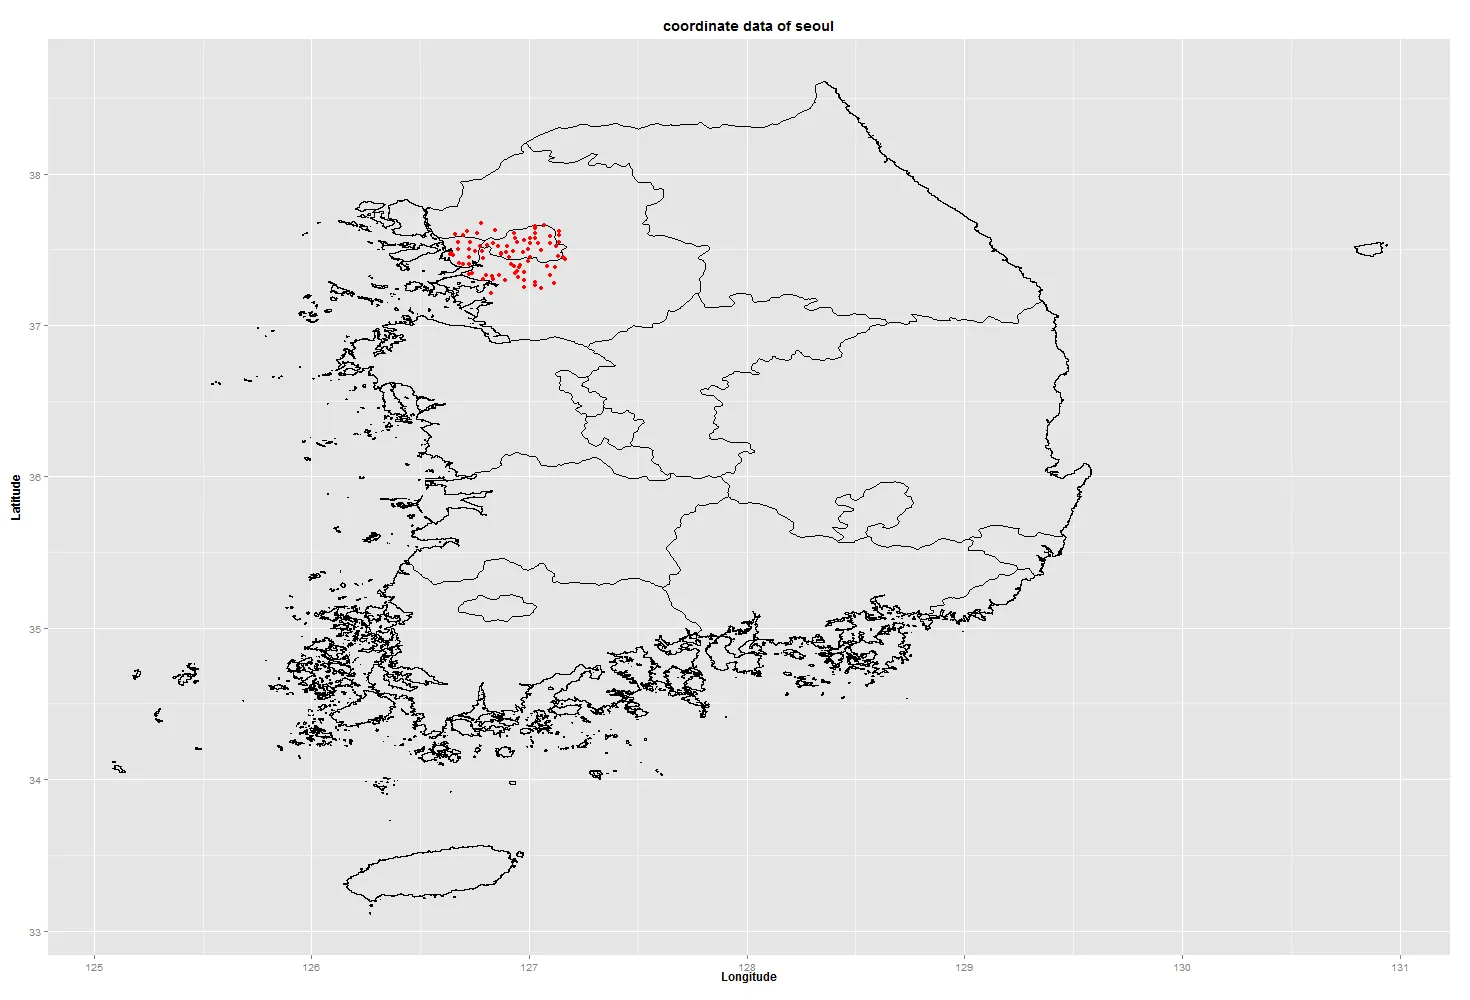
现在,我希望其中某些点能够以不同的颜色标记在地图上,根据它们的ID来区分。例如,我想让这些ID(111141、111142、111241、111281、111301、131141、131144、131161)以蓝色显示,而其余的ID则以红色保留。如何实现这一点呢?
1个回答

5
也许:
library(raster)
library(rgeos)
library(ggplot2)
library(ggthemes)

skorea <- gSimplify(getData("GADM", country= "KOR", level=1), tol=0.001, TRUE)
skorea <- fortify(skorea)

st <- read.csv("station.csv")
st$color <- "red"
st[st$ID %in% c(111141, 111142, 111241, 111281, 111301, 131141, 131144, 131161),]$color <- "blue" 

gg <- ggplot()
gg <- gg + geom_map(data=skorea, map=skorea, 
                    aes(x=long, y=lat, map_id=id, group=group),
                    fill=NA, color="black")
gg <- gg + geom_point(data=st, aes(x=LON, y=LAT, color=color), 
                      alpha=1, na.rm=TRUE)
gg <- gg + scale_size(range=c(2,7))
gg <- gg + scale_color_identity()
gg <- gg + labs(title= "coordinate data of seoul", 
                x="Longitude", y= "Latitude")
gg <- gg + coord_map()
gg <- gg + theme_map()
gg <- gg + theme(title= element_text(hjust = 0.5, vjust=1, face="bold"))
gg

enter image description here


网页内容由stack overflow 提供, 点击上面的
可以查看英文原文,
原文链接