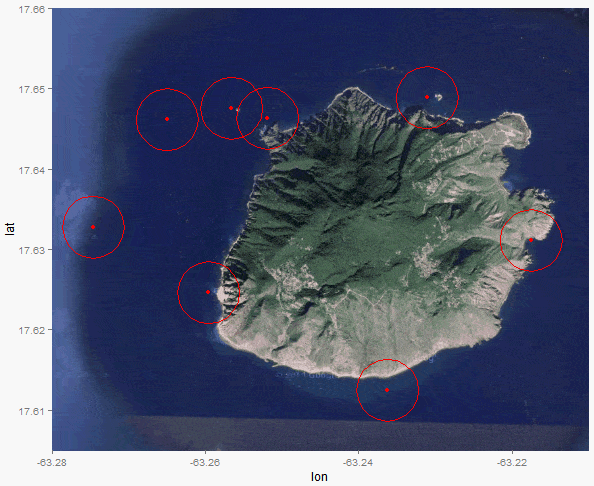
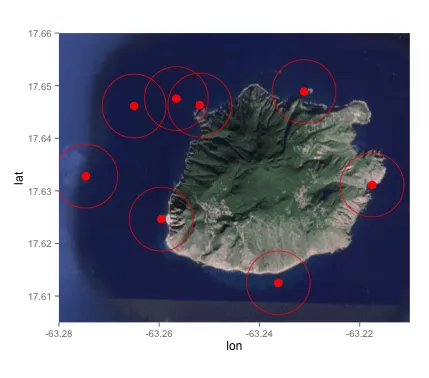
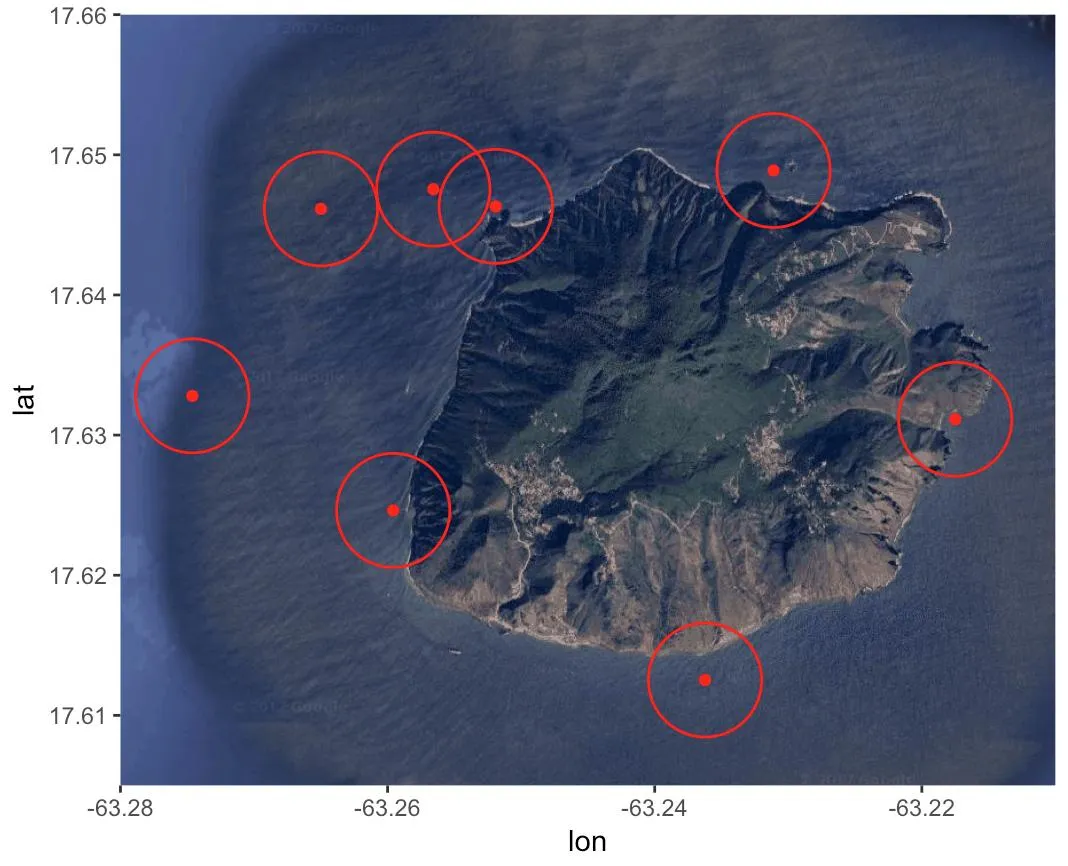
在ggplot2中,围绕地图上的某个点绘制一定半径的圆形。

19

我有一张地图,上面标记了8个点:

library(ggplot2)
library(ggmap)
data = data.frame(
    ID = as.numeric(c(1:8)),
    longitude = as.numeric(c(-63.27462, -63.26499, -63.25658, -63.2519, -63.2311, -63.2175, -63.23623, -63.25958)),
    latitude = as.numeric(c(17.6328, 17.64614, 17.64755, 17.64632, 17.64888, 17.63113, 17.61252, 17.62463))
)

island = get_map(location = c(lon = -63.247593, lat = 17.631598), zoom = 13, maptype = "satellite")
islandMap = ggmap(island, extent = "panel", legend = "bottomright")
RL = geom_point(aes(x = longitude, y = latitude), data = data, color = "#ff0000")
islandMap + RL + scale_x_continuous(limits = c(-63.280, -63.21), expand = c(0, 0)) + scale_y_continuous(limits = c(17.605, 17.66), expand = c(0, 0))

现在我想要绘制出8个已标注位置周围的一个圆圈,这个圆圈的半径需要是450米。

我的意思是,使用ggplot来实现这个,可以参考以下链接:https://gis.stackexchange.com/questions/119736/ggmap-create-circle-symbol-where-radius-represents-distance-miles-or-km

我该如何实现呢?

5个回答

23

如果您只在地球的一个小区域工作,这里有一个近似值。每一纬度度数代表40075/360公里。每一经度度数代表(40075/360)* cos(纬度)公里。有了这个,我们可以大约计算包括所有圆上点的数据框,知道圆心和半径。

library(ggplot2)
library(ggmap)
data = data.frame(
    ID = as.numeric(c(1:8)),
    longitude = as.numeric(c(-63.27462, -63.26499, -63.25658, -63.2519, -63.2311, -63.2175, -63.23623, -63.25958)),
    latitude = as.numeric(c(17.6328, 17.64614, 17.64755, 17.64632, 17.64888, 17.63113, 17.61252, 17.62463))
)

#################################################################################
# create circles data frame from the centers data frame
make_circles <- function(centers, radius, nPoints = 100){
    # centers: the data frame of centers with ID
    # radius: radius measured in kilometer
    #
    meanLat <- mean(centers$latitude)
    # length per longitude changes with lattitude, so need correction
    radiusLon <- radius /111 / cos(meanLat/57.3) 
    radiusLat <- radius / 111
    circleDF <- data.frame(ID = rep(centers$ID, each = nPoints))
    angle <- seq(0,2*pi,length.out = nPoints)

    circleDF$lon <- unlist(lapply(centers$longitude, function(x) x + radiusLon * cos(angle)))
    circleDF$lat <- unlist(lapply(centers$latitude, function(x) x + radiusLat * sin(angle)))
    return(circleDF)
}

# here is the data frame for all circles
myCircles <- make_circles(data, 0.45)
##################################################################################


island = get_map(location = c(lon = -63.247593, lat = 17.631598), zoom = 13, maptype = "satellite")
islandMap = ggmap(island, extent = "panel", legend = "bottomright")
RL = geom_point(aes(x = longitude, y = latitude), data = data, color = "#ff0000")
islandMap + RL + 
    scale_x_continuous(limits = c(-63.280, -63.21), expand = c(0, 0)) + 
    scale_y_continuous(limits = c(17.605, 17.66), expand = c(0, 0)) +
    ########### add circles
    geom_polygon(data = myCircles, aes(lon, lat, group = ID), color = "red", alpha = 0)

做得真好。按照111的方法进行,但57.3从哪里来的? - atclaus
1弧度=57.3度(180 / pi) - GL_Li

9

好的,如已经建议的帖子所述 - 切换到基于米的投影,然后再切回原先的投影:

library(rgeos)
library(sp)
d <- SpatialPointsDataFrame(coords = data[, -1], 
                            data = data, 
                            proj4string = CRS("+init=epsg:4326"))
d_mrc <- spTransform(d, CRS("+proj=merc +a=6378137 +b=6378137 +lat_ts=0.0 +lon_0=0.0 +x_0=0.0 +y_0=0 +k=1.0 +units=m +nadgrids=@null +no_defs"))

现在,可以用米来指定 width
d_mrc_bff_mrc <- gBuffer(d_mrc, byid = TRUE, width = 450)

使用 geom_path 将其转换回来并添加到图表中:

d_mrc_bff <- spTransform(d_mrc_bff_mrc, CRS("+init=epsg:4326"))
d_mrc_bff_fort <- fortify(d_mrc_bff)
islandMap + 
  RL + 
  geom_path(data=d_mrc_bff_fort, aes(long, lat, group=group), color="red") + 
  scale_x_continuous(limits = c(-63.280, -63.21), expand = c(0, 0)) + 
  scale_y_continuous(limits = c(17.605, 17.66), expand = c(0, 0)) 

enter image description here


5

计算给定纬度和经度的距离(以公里为单位)并不是非常直接的;例如,在赤道上,1度纬度/经度的距离比在极地要大。如果您想要一种简单的解决方法,可以通过目视精确度来尝试:

islandMap + RL + 
  scale_x_continuous(limits = c(-63.280, -63.21), expand = c(0, 0)) + 
  scale_y_continuous(limits = c(17.605, 17.66), expand = c(0, 0)) + 
  geom_point(aes(x = longitude, y = latitude), data = data, size = 20, shape = 1,  color = "#ff0000")

enter image description here

你需要调整第二个geom_point中的size参数,以接近你想要的效果。希望这可以帮助到你!


非常感谢!这可能是一个解决方案,但它并不像我希望的那样准确。欢迎提出任何其他建议。 - Shark167
1
确实,它不是视觉上可靠的,如果你打算发布的话也不应该把它当做这样。我不确定点的大小和轴标记之间的关系是什么。尽管如此,我尝试过类似的东西了,因为地球不是平面的(显然),所以你必须加入一个z轴才能准确地在平面地图上显示一个圆形。 - Nancy
还要注意,如果你画的“圆”足够大,它们会因为球体的原因被拉成椭圆形。真是有点遗憾,哈哈。 - Nancy
谢谢你,南希!如果我们坚持“地球是平的”这个观点,一切都会容易得多。 - Shark167

4
一个准确的解决方案是使用geosphere::destPoint()函数。这个函数可以在不切换投影的情况下工作。
定义一个函数来确定以某一点为中心,半径为特定值的360个点:
library(dplyr)
library(geosphere)

fn_circle <- function(id1, lon1, lat1, radius){ 
   data.frame(ID = id1, degree = 1:360) %>%
      rowwise() %>%
      mutate(lon = destPoint(c(lon1, lat1), degree, radius)[1]) %>%
      mutate(lat = destPoint(c(lon1, lat1), degree, radius)[2]) 
}

data的每一行应用函数并转换为数据框:

circle <- apply(data, 1, function(x) fn_circle(x[1], x[2], x[3], 450))
circle <- do.call(rbind, circle)

然后可以通过以下方式轻松获取地图:

islandMap + 
   RL +
   scale_x_continuous(limits = c(-63.280, -63.21), expand = c(0, 0)) + 
   scale_y_continuous(limits = c(17.605, 17.66), expand = c(0, 0)) +
   geom_polygon(data = circle, aes(lon, lat, group = ID), color = "red", alpha = 0)

enter image description here


2
一个使用sf包中的st_buffer()函数的解决方案。
library(ggmap)
library(ggplot2)
library(sf)

data <- data.frame(
  ID = 1:8,
  longitude = c(-63.27462, -63.26499, -63.25658, -63.2519, 
                -63.2311, -63.2175, -63.23623, -63.25958),
  latitude = c(17.6328, 17.64614, 17.64755, 17.64632, 
               17.64888, 17.63113, 17.61252, 17.62463)
)

将 data.frame 转换为 sf 对象:
points_sf <- sf::st_as_sf(data, coords = c("longitude", "latitude"), crs = 4326)

在这个例子中,我们使用UTM 20区,其中包含了该岛屿的坐标:
data_sf_utm <- sf::st_transform(points_sf, "+proj=utm +zone=20")

现在我们可以将该点缓冲450米:
circle <- sf::st_buffer(data_sf_utm, dist = 450)

ggmap似乎在使用geom_sf时存在一些问题。将inherit.aes设置为FALSE可以返回所需的地图。
island <- ggmap::get_map(location = c(lon = -63.247593, lat = 17.631598), zoom = 14, maptype = "satellite")

ggmap(island, extent = "panel", legend = "bottomright") + 
  geom_sf(data = points_sf, color = "red", inherit.aes = FALSE) +
  geom_sf(data = circle, color = "red", alpha = 0, inherit.aes = FALSE)

创建于2020年10月11日,使用reprex package(v0.3.0)。

网页内容由stack overflow 提供, 点击上面的
可以查看英文原文,
原文链接