如何优化生成R语言图表的代码

3

你能帮我优化下面的代码吗? 你可以看到,我使用了相同的日期两次,一次用于生成图形,一次用于生成子集y。 结果是正确的,但我想请帮忙至少只使用一次日期并进行其他必要的优化。 欢迎任何帮助。

非常感谢!

library(dplyr)
library(lubridate)
library(tidyverse)

#dataset
df <- structure(
  list(date1 = c("2021-06-28","2021-06-28","2021-06-28","2021-06-28","2021-06-28",
                 "2021-06-28","2021-06-28","2021-06-28"),
       date2 = c("2021-04-02","2021-04-03","2021-04-08","2021-04-09","2021-04-10","2021-07-01","2021-07-02","2021-07-03"),
       Week= c("Friday","Saturday","Thursday","Friday","Saturday","Thursday","Friday","Monday"),
       DR01 = c(4,1,4,3,3,4,3,6), DR02= c(4,2,6,7,3,2,7,4),DR03= c(9,5,4,3,3,2,1,5),
       DR04 = c(5,4,3,3,6,2,1,9),DR05 = c(5,4,5,3,6,2,1,9),
       DR06 = c(2,4,3,3,5,6,7,8),DR07 = c(2,5,4,4,9,4,7,8)),
  class = "data.frame", row.names = c(NA, -8L))
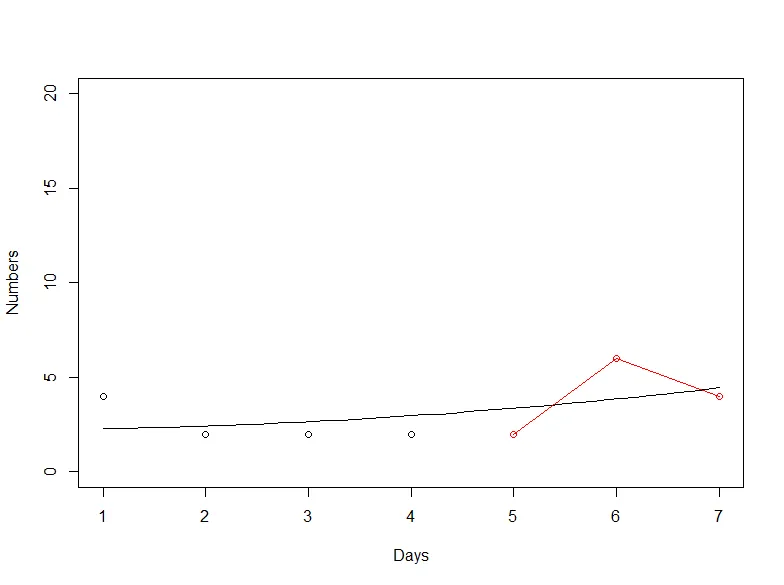
#Generate graph

dmda<-"2021-07-01"
dta<-df

datas<-dta %>%
  filter(date2 == ymd(dmda)) %>%
  summarize(across(starts_with("DR"), sum)) %>%
  pivot_longer(everything(), names_pattern = "DR(.+)", values_to = "val") %>%
  mutate(name = as.numeric(name))
colnames(datas)<-c("Days","Numbers")
attach(datas)
plot(Numbers ~ Days, ylim=c(0,20))

model <- nls(Numbers ~ b1*Days^2+b2,start = list(b1 = 47,b2 = 0))

new.data <- data.frame(Days = seq(min(Days),max(Days),len = 45))
lines(new.data$Days,predict(model,newdata = new.data))


#Add the y points to the graph

df[, 1:2] = lapply(df[, 1:2], FUN = as_date)

get_cutoff = function(date) {
  date2 = as_date(date)
  date1 = df[1,1]
  as.numeric(date2 - date1 + 1)
}

subset_data = function(date, start_index) {
  date = as_date(date)
  if (date > df[1,1]) {
    end_index = start_index + get_cutoff(date) - 1
    df[, -c(start_index:end_index)] %>%
      filter(date2 == date)
  } else {
    return(df)
  }
} 

y<-subset_data("2021-07-01", 4)
y

pivot_longer(y, 
             cols=c(starts_with("DR"))) %>% 
  mutate(day = parse_number(name)) -> new_y
new_y

lines(x=new_y$day, y=new_y$value, col="red")
points(x=new_y$day, y=new_y$value, col="red")

enter image description here


1
不要使用attach(https://dev59.com/t2kw5IYBdhLWcg3wNXz2) - Ronak Shah
1
你想要优化什么?速度?可读性?这真的是你代码的瓶颈吗? - danlooo
事实上,我的优化想法是不需要两次使用相同的日期,也就是说,我只会输入一次日期。如果您认为可以将代码排列得更好,那也是欢迎的。 - user16774617
2个回答

2

请进行以下更改:

  • 仅加载使用的软件包
  • 可以消除lubridate
  • 不需要dta
  • 在筛选器中,我们不需要将dmda转换为日期类
  • pivot_wider可以转换名称
  • 不要使用attach
  • 模型的参数是线性的,因此请使用lm而不是nls
  • 用curve替换new.data/lines
  • 不要覆盖df
  • 简化截止计算
  • 使用type = "o"将点/线减少到只有线
  • 在lines中使用subset

现在假设dfdmda已经按照问题中的定义,我们有以下内容。

library(dplyr)
library(tidyr)

datas <- df %>%
  filter(date2 == dmda) %>%
  summarize(across(starts_with("DR"), sum)) %>%
  pivot_longer(everything(), names_pattern = "DR(.+)", 
    names_to = "Days", values_to = "Numbers", 
    names_transform = list(Days = as.numeric))

plot(Numbers ~ Days, datas, ylim=c(0,20))

model <- lm(Numbers ~ I(Days^2), datas)
rng <- range(datas$Days)
curve(predict(model, list(Days = x)), rng[1], rng[2], add = TRUE)

# assume this for cutoff.  You may or may not need to change this line.
cutoff <- as.numeric(as.Date(dmda) - first(as.Date(df$date1))) + 1
lines(Numbers ~ Days, datas, subset = seq_len(nrow(datas)) > cutoff,
  type = "o" , col = "red")

screenshot


你的流程图是我在学习和使用R时应该知道或被教授的。 - PesKchan
非常感谢Grothendieck,但是当我运行你的代码时它并没有起作用。你能否再次测试一下,并在你的代码中插入带有日期的dmda? - user16774617
已经修复。现在请尝试。首先将df和dmda复制到一个新的R会话中,然后复制答案中的代码。 - G. Grothendieck

1

由于您已经在tidyverse中工作,我使用ggplot而不是基本的R绘图函数。以下内容将帮助您在单个图表上绘制所有内容。

dmda<-"2021-07-01"
dta<-df

## Rather than rely on column position, explicitly set the number
## of days desired for highlighting on plot
num_days <- 3

model <- nls(Numbers ~ b1*Days^2+b2,start = list(b1 = 47,b2 = 0))
new.data <- data.frame(Days = seq(min(Days),max(Days),len = 45)) %>%
    mutate(Numbers = predict(model, newdata = .))

datas<-dta %>%
    filter(date2 == ymd(dmda)) %>%
    summarize(across(starts_with("DR"), sum)) %>%
    ## Can convert data to numeric and create column names inside pivot_longer
    pivot_longer(everything(), names_pattern = "DR(.+)", 
                 values_to = "Numbers", names_to = "Days",
                 names_transform = list(Days = as.numeric, Numbers = as.numeric)) %>%
    ## Create flag for whether the values are in the final number of days
    mutate(subs = 1:n() > (n() - num_days))


plt <- ggplot(datas, aes(x = Days, y = Numbers)) +
    geom_point(aes(color = subs)) +
    geom_line(data = filter(datas, subs == TRUE), color = "red") +
    geom_line(data = new.data, color = "black") +
    scale_y_continuous(limits = c(0, 20)) +
    scale_color_manual(values = c("black", "red"))
plt

enter image description here


网页内容由stack overflow 提供, 点击上面的
可以查看英文原文,
原文链接