如何压缩 Pandas 数据框?(数据透视表)

6

假设我们有一个如下所示的DataFrame:

day_of_week   ice_cream     count   proportion
0   Friday    vanilla       638     0.094473
1   Friday    chocolate     2048    0.663506
2   Friday    strawberry    4088    0.251021
3   Monday    vanilla       448     0.079736
4   Monday    chocolate     2332    0.691437
5   Monday    strawberry    441     0.228828
6   Saturday  vanilla       24      0.073350
7   Saturday  chocolate     244     0.712930  ...   ...

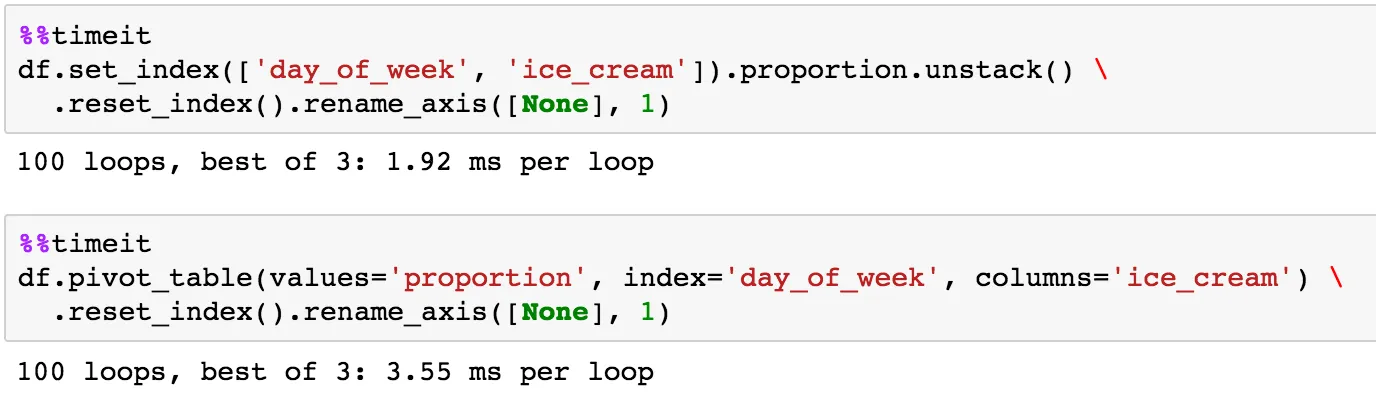
我希望得到一个新的DataFrame,以day_of_week作为索引进行合并,使其看起来像这样:
    day_of_week vanilla    chocolate   strawberry
0   Friday      0.094473   0.663506    0.251021 
1   Monday      0.079736   0.691437    0.228828
2   Saturday    ...        ...         ...

我该如何最简单地实现这个功能?


在 pandas 中查找 pivot 函数。 - lordingtar
4个回答

4

df.pivot_table 是正确的解决方案:

In[31]: df.pivot_table(values='proportion', index='day_of_week', columns='ice_cream').reset_index()
Out[31]: 
    ice_cream day_of_week  chocolate  strawberry   vanilla
0              Friday   0.663506    0.251021  0.094473
1              Monday   0.691437    0.228828  0.079736
2            Saturday   0.712930         NaN  0.073350

如果你不使用reset_index(),它会返回一个带索引的数据框,这对你可能更有用。
请注意,当values列不是元组(index, columns)的函数时,数据透视表必然执行维度缩减。如果有多个具有不同value(index,columns)对,则pivot_table通过使用聚合函数(默认为mean)将维度降至一维。

1
使用.reset_index()可以得到OP所需的输出吗? - AChampion
这个函数的反函数是什么? - Snow
尝试堆栈和取消堆栈。 - Sebastian Wozny

2
您正在寻找透视表功能。
df = pd.pivot_table(df, index='day_of_week', columns='ice_cream', values = 'proportion')

您将获得:

ice_cream   chocolate   strawberry  vanilla
day_of_week         
Friday      0.663506    0.251021    0.094473
Monday      0.691437    0.228828    0.079736
Saturday    0.712930    NaN         0.073350

1
使用 set_indexunstack
df.set_index(['day_of_week', 'ice_cream']).proportion.unstack() \
  .reset_index().rename_axis([None], 1)

  day_of_week  chocolate  strawberry   vanilla
0      Friday   0.663506    0.251021  0.094473
1      Monday   0.691437    0.228828  0.079736
2    Saturday   0.712930         NaN  0.073350

计时 vs 透视表

enter image description here


1
使用数据透视表:
import pandas as pd
import numpy as np

df = pd.DataFrame({'day_of_week':['Friday','Sunday','Monday','Sunday','Friday','Friday'], \
'count':[200,300,100,50,110,90], 'ice_cream':['choco','vanilla','vanilla','choco','choco','straw'],\
'proportion':[.9,.1,.2,.3,.8,.4]})

print df

# If you like replace np.nan with zero
tab = pd.pivot_table(df,index='day_of_week',columns='ice_cream', values=['proportion'],fill_value=np.nan)
print tab

输出:

   count day_of_week ice_cream  proportion
0    200      Friday     choco         0.9
1    300      Sunday   vanilla         0.1
2    100      Monday   vanilla         0.2
3     50      Sunday     choco         0.3
4    110      Friday     choco         0.8
5     90      Friday     straw         0.4
            proportion              
ice_cream        choco straw vanilla
day_of_week                         
Friday            0.85   0.4     NaN
Monday             NaN   NaN     0.2
Sunday            0.30   NaN     0.1

1
哇,你居然花时间创建了一个DataFrame。你知道 pd.read_clipboard() 这个函数吗? - Sebastian Wozny

网页内容由stack overflow 提供, 点击上面的
可以查看英文原文,
原文链接