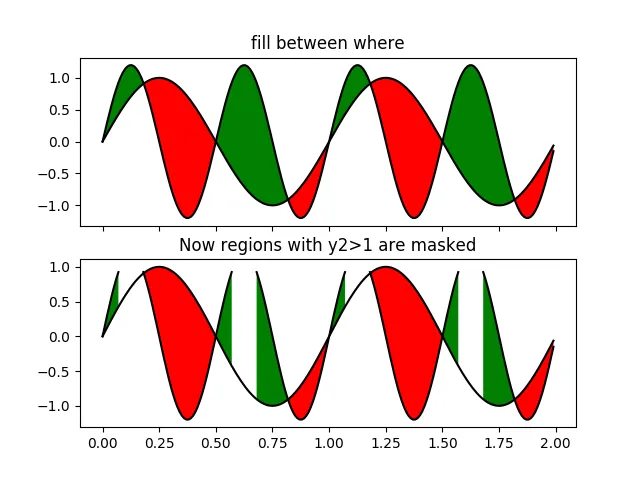
我想要给图形线和x轴之间的空间填充颜色。颜色应该基于线上对应点的值。就像第一个图一样:
 (https://matplotlib.org/3.1.1/gallery/lines_bars_and_markers/fill_between_demo.html)
如果值高于100,应该是红色的;如果低于100,应该是绿色的。我需要的图形应该是红绿交替的。
目前我有以下代码:
这导致以下图形: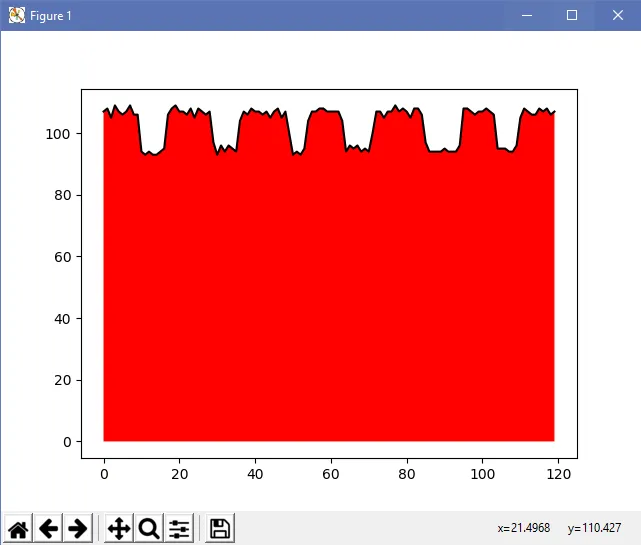 值小于100的区域应为绿色。但是,线和x轴之间的空间始终基于数组中的第一个值(在本例中为红色)。如何解决这个问题?
(https://matplotlib.org/3.1.1/gallery/lines_bars_and_markers/fill_between_demo.html)如果值高于100,应该是红色的;如果低于100,应该是绿色的。我需要的图形应该是红绿交替的。
目前我有以下代码:
import matplotlib.pyplot as plt

lenght = 120

y = [107, 108, 105, 109, 107, 106, 107, 109, 106, 106, 94, 93, 94, 93, 93, 94, 95, 106, 108, 109, 107, 107, 106, 108, 105, 108, 107, 106, 107, 97, 93, 96, 94, 96, 95, 94, 104, 107, 106, 108, 107, 107, 106, 107, 105, 107, 108, 105, 107, 100, 93, 94, 93, 95, 104, 107, 107, 108, 108, 107, 107, 107, 107, 104, 94, 96, 95, 96, 94, 95, 94, 100, 107, 107, 105, 107, 107, 109, 107, 108, 107, 105, 108, 108, 106, 97, 94, 94, 94, 94, 95, 94, 94, 94, 96, 108, 108, 107, 106, 107, 107, 108, 107, 106, 95, 95, 95, 94, 94, 96, 105, 108, 107, 106, 106, 108, 107, 108, 106, 107]

x = [x for x in range(lenght)]

lvl = lenght * [100]

fig, ax = plt.subplots()

ax.plot(x, y, color="black")
ax.fill_between(x, 0, y, where=y>lvl, facecolor='red', interpolate=True)
ax.fill_between(x, 0, y, where=y<=lvl, facecolor='green', interpolate=True)

plt.show()
这导致以下图形:
值小于100的区域应为绿色。但是,线和x轴之间的空间始终基于数组中的第一个值(在本例中为红色)。如何解决这个问题?