 大家晚上好... 我正在学习如何在Tkinter GUI中嵌入matplotlib图形,但是我没有成功,我附上了一张图片,以展示正在发生的情况,请帮助我。
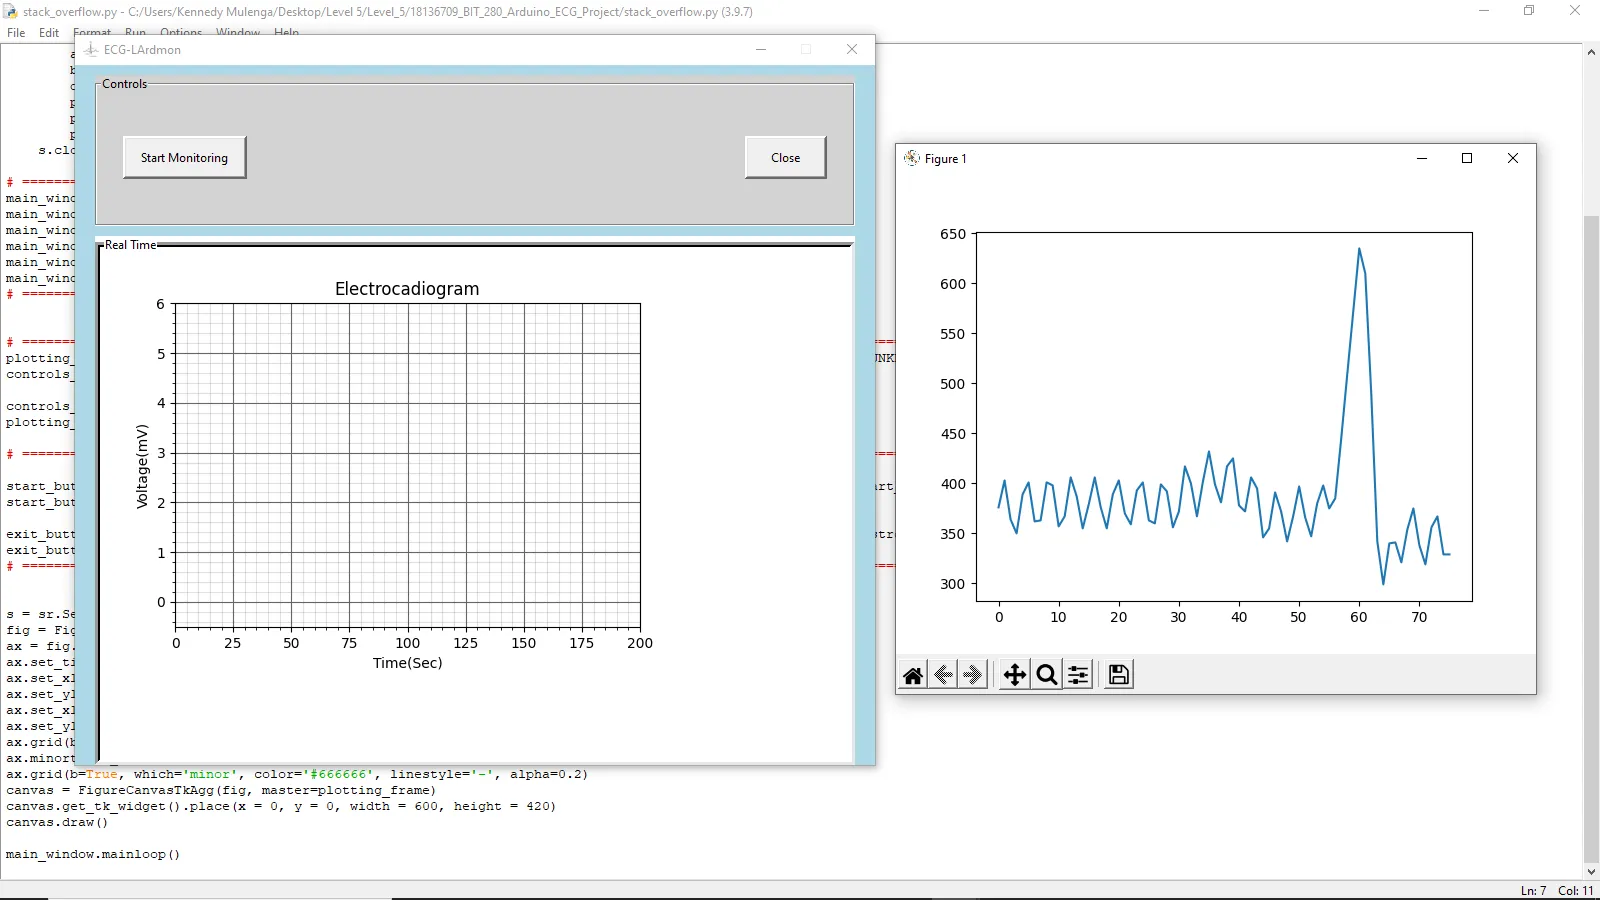
我从Arduino串口获取数据(心电图读数),并用matplotlib将其绘制(嵌入到Tkinter GUI中),但是当我运行下面的代码时,会创建一个matplotlib图,其中正在进行绘制。
请注意,我的目标是直接在GUI上的图形上绘制图案,不要担心已经绘制的图形。
[![enter image description here][1]][1]import matplotlib.pyplot as plt
from matplotlib.backends.backend_tkagg import (FigureCanvasTkAgg, NavigationToolbar2Tk)
from matplotlib.figure import Figure
import numpy as np
import serial as sr
import time


def start_plot():
    data = np.array([])
    while True:
        a = s.readline()
        a.decode()
        b = float(a[0:4])
        data = np.append(data, b);
        plt.cla()
        plt.plot(data)
        plt.pause(0.01)
    s.close()

main_window = Tk()
main_window.configure(background='light blue')
main_window.iconbitmap('lardmon_icon.ico')
main_window.title("ECG-LArdmon")
main_window.geometry('800x700')
main_window.resizable(width=False, height=False)


plotting_frame = LabelFrame(main_window, text='Real Time', bg='white', width=300, height=440, bd=5, relief=SUNKEN)
controls_frame = LabelFrame(main_window, text='Controls', background='light grey', height=150)

controls_frame.pack(fill='both', expand='1', side=TOP, padx=20, pady=10)
plotting_frame.pack(fill='both', expand='yes', side=BOTTOM, padx=20)


start_button = Button(controls_frame, text='Start Monitoring', width=16, height=2, borderwidth=3, command=start_plot)
start_button.pack(side=LEFT, padx=26)

exit_button = Button(controls_frame, text='Close', width=10, height=2, borderwidth=3, command=main_window.destroy)
exit_button.pack(side=RIGHT, padx=26)


s = sr.Serial('COM3', 9600)
fig = Figure()
ax = fig.add_subplot(111)
ax.set_title("Electrocadiogram")
ax.set_xlabel("Time(Sec)")
ax.set_ylabel("Voltage(mV)")
ax.set_xlim(0, 200)
ax.set_ylim(-0.5, 6)
ax.grid(b=True, which='major', color='#666666', linestyle='-')
ax.minorticks_on()
ax.grid(b=True, which='minor', color='#666666', linestyle='-', alpha=0.2)
canvas = FigureCanvasTkAgg(fig, master=plotting_frame)
canvas.get_tk_widget().place(x = 0, y = 0, width = 600, height = 420)
canvas.draw()

main_window.mainloop()