ggplot中注释的文本格式化

8

是否可能使用HTML代码进行注释?我想只着色几个单词而不是整个文本。

library(tidyverse)
#> Warning: package 'ggplot2' was built under R version 4.0.2

mtcars %>%
  ggplot(aes(x = hp, y = mpg)) +
  geom_point() +
  annotate(geom = "text", label = "I'm <span style='color: red;'>red</span> \n and i'm <span style='color: orange;'>orange</span>",
           x = 250, y = 25)

reprex包 (v0.3.0)于2020年08月22日创建

1个回答

11
你可以使用包'ggtext'。它是相当新的。你唯一需要改变的是在你的例子中替换geom:使用"richtext"代替"text"
library(tidyverse)
library(ggtext)
#> Warning: package 'ggplot2' was built under R version 4.0.2

mtcars %>%
  ggplot(aes(x = hp, y = mpg)) +
  geom_point() +
  annotate(geom = "richtext", label = "I'm <span style='color: red;'>red</span> \n and i'm <span style='color: orange;'>orange</span>",
           x = 250, y = 25)

enter image description here

可以使用fill = NA来移除背景。要移除边框线,可以使用label.color = NA

library(tidyverse)
library(ggtext)

mtcars %>%
  ggplot(aes(x = hp, y = mpg)) +
  geom_point() +
  annotate(geom = "richtext", label = "I'm <span style='color: red;'>red</span>\n and i'm <span style='color: orange;'>orange</span>",
           x = 250, y = 25, fill = NA, label.color = NA)

enter image description here


4
要实现所需的输出效果,您应该使用 <br> 标签而不是 \n。@alberson-miranda - Carlos Vecina Tebar
你知道是否可以仅更改文本的部分填充吗?我尝试过类似于
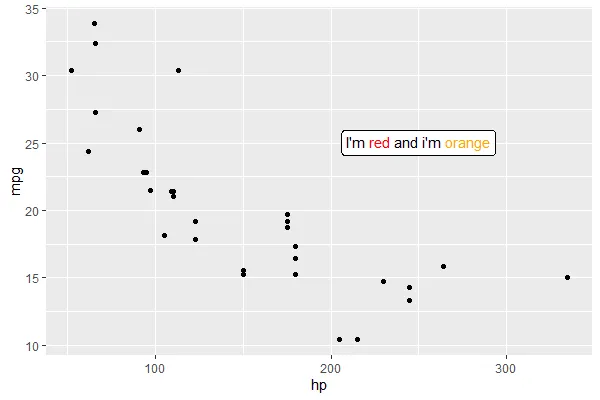
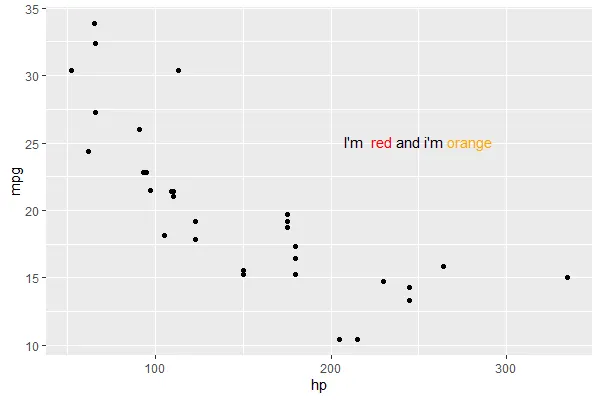
<span style='background-color:#fff'>的方法,但没有成功。 - AndrewGB

网页内容由stack overflow 提供, 点击上面的
可以查看英文原文,
原文链接