我能在ggplot注释中使用标记吗?
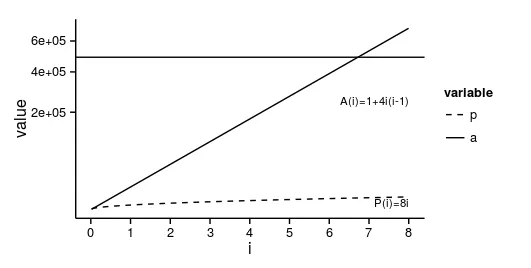
假设我有这张图:
p <- function(i) 8*i
a <- function(i) 1+4*i*(i-1)

library(ggplot2)
library(reshape2)

i <- 1:(8*365/7)
d <- data.frame(i=i,p=p(i),a=sapply(i,a))
d <- melt(d, id.vars='i')
p <- ggplot(d, aes(i, value, linetype=variable)) +
    geom_hline(yintercept=700^2) +
    geom_line() +
    scale_linetype_manual(values=c(2,1)) +
    #geom_point() +
    scale_x_continuous(breaks=(0:20)*365/7, labels=0:20) +
    #scale_y_continuous(breaks=c(0,700^2), labels=c(0,expression(L^2)))
    scale_y_sqrt() +
    #scale_y_log10() +
    annotate('text', 8*365/7, 1e3, label="P(i)=8i", hjust=1, size=3) +
    annotate('text', 8*365/7, 2.5e5, label="A(i)=1+4i(i-1)", hjust=1, size=3)
print(p + theme_classic())
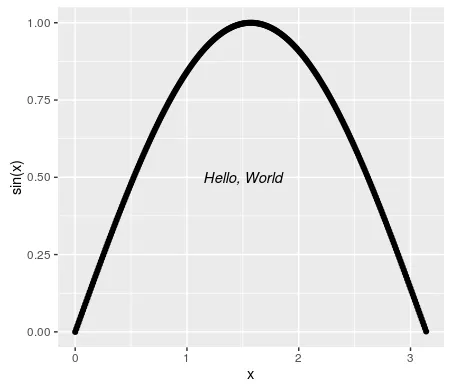
我知道我可以使用 fontface=3 并将所有内容放在斜体中。但我不想让数字变成斜体,只想让变量 i 斜体显示。最好不要让 P 和 A 也变成斜体。
有什么建议吗?
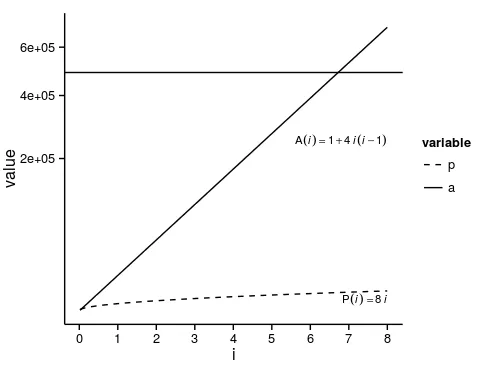
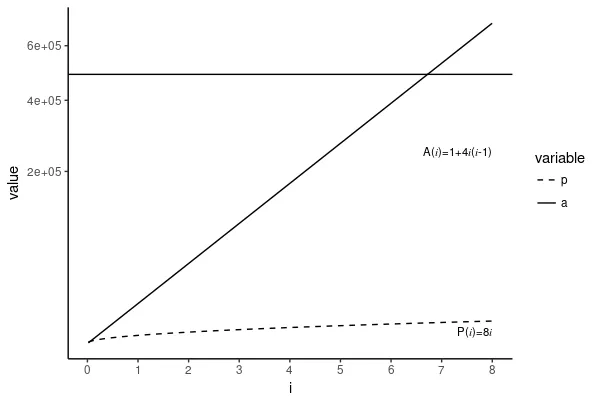

fontface参数也适用于geom_text。 - pbnelson