我正在尝试绘制两个数据集,它们之间的差异有几个数量级。经过一些研究(实际上只需要进行一次谷歌搜索),我发现了
然而,在使用它时遇到了一些问题。我使用这个工具生成出版级别的图形,但有些东西令我困扰。
系统信息:matplotlib v1.3.1,python v2.7.4,Ubuntu 操作系统。
请考虑以下代码:
现在,当查看这个低分辨率的输出时,我没有发现任何奇怪的东西: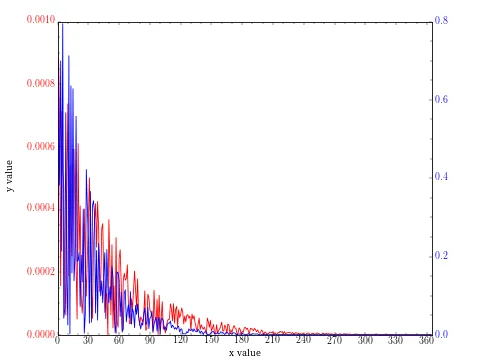 然而,当放大到高分辨率(比如说,
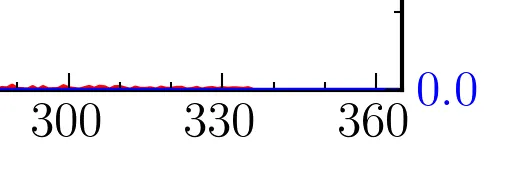 很明显,第二个坐标轴中的线条绘制在第一个坐标轴的脊柱上。
我应该如何解决这个问题?是否有一种方法可以重新绘制一个轴实例的脊柱?
我尝试过:
twinx() 函数。然而,在使用它时遇到了一些问题。我使用这个工具生成出版级别的图形,但有些东西令我困扰。
系统信息:matplotlib v1.3.1,python v2.7.4,Ubuntu 操作系统。
请考虑以下代码:
import numpy as np
import matplotlib.pyplot as plt
from matplotlib.ticker import MaxNLocator
from matplotlib.ticker import AutoMinorLocator


time = np.arange(0, 365, 1)
y1 = np.random.rand(len(time)) * np.exp(-0.03 * time)
y2 = 0.001 * np.random.rand(len(time)) * np.exp(-0.02 * time)

for i in range(30):
    y2[-i] = 0

fig = plt.figure(figsize=(8,6), dpi=300)
fig.subplots_adjust(hspace=0.0, right=0.9, top=0.94, left=0.12, bottom=0.07)
ax1 = fig.add_subplot(111)
ax2 = ax1.twinx()

for tl in ax1.get_yticklabels():
    tl.set_color('r')
for tl in ax2.get_yticklabels():
    tl.set_color('b')

for ax in [ax1, ax2]:
    ax.yaxis.set_major_locator(MaxNLocator(
        nbins=5,
        steps=[1,2,3,4,5,10],
        integer=False,
        symmetric=False,
        prune=None))
    ax.yaxis.set_minor_locator(AutoMinorLocator(4))

ax2.plot(time, y1, 'b-')
ax1.plot(time, y2, 'r-')
ax1.set_ylabel(r"y value", labelpad=15)
ax1.set_xlabel(r"x value")
ax1.set_xlim(0,365)
ax1.set_xticks(range(0,370,30))
ax1.xaxis.set_minor_locator(AutoMinorLocator(3))

fig.savefig("Errorplot.png", dpi=60)
现在,当查看这个低分辨率的输出时,我没有发现任何奇怪的东西:
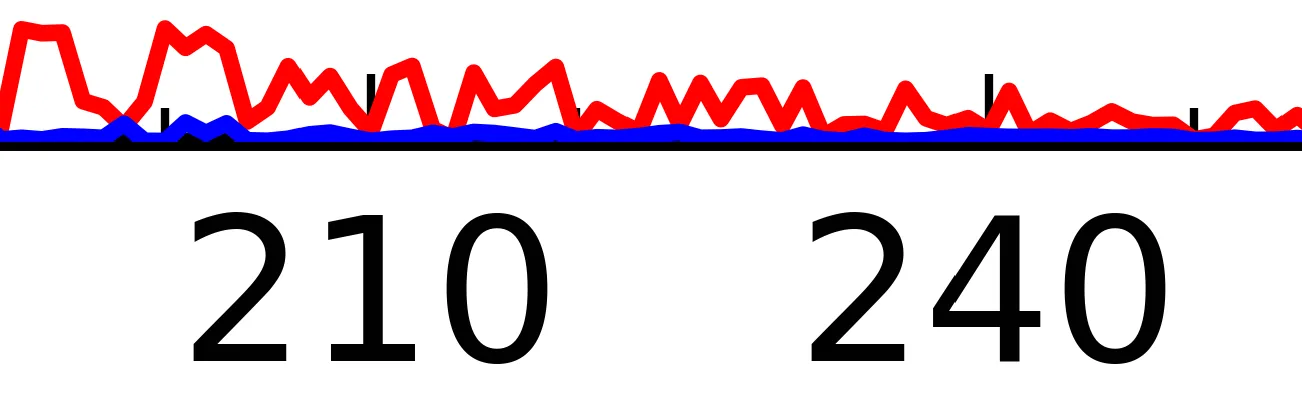
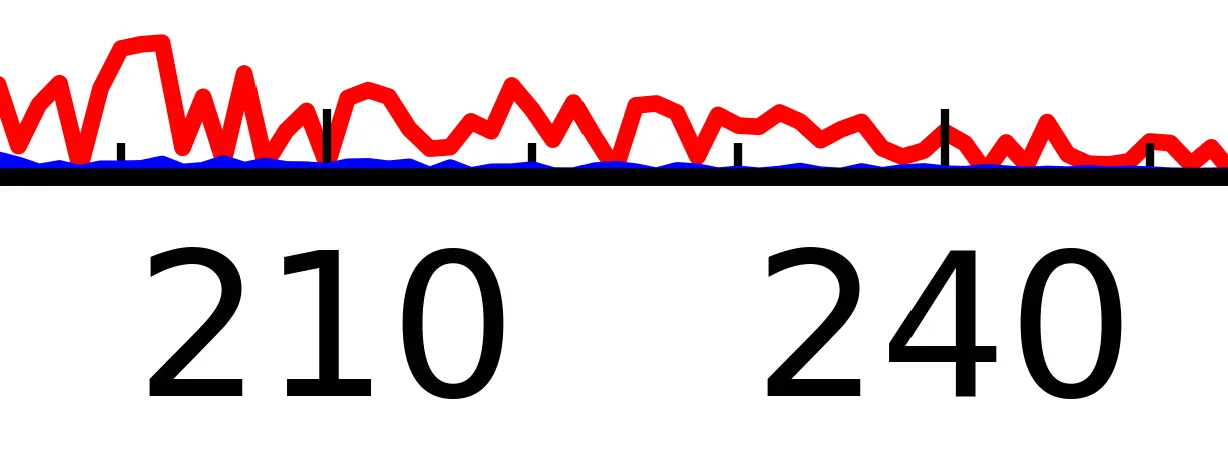
然而,当放大到高分辨率(比如说,dpi=300)版本时,我看到了以下内容:
很明显,第二个坐标轴中的线条绘制在第一个坐标轴的脊柱上。我应该如何解决这个问题?是否有一种方法可以重新绘制一个轴实例的脊柱?
我尝试过:
- 更改
plot()调用的顺序 - 将
zorderkwarg设置为-1、-10。即使ax2的zorder比ax1小,我也会出现这种行为。 - 与上述结合使用:
ax2.spines['bottom'].set_zorder(10)
v 1.2.1版本。也许更新会解决这个问题。 - tschoppi1.3.1版本(甚至检查了matplotlib.__version__变量),但是仍然存在同样的问题... - tschoppi