在 Folium 地图上画箭头线是否可行?

11

我正在使用Python 2.7.11上的Jupyter Notebook Server 4.2.1运行Folium 0.2.1。

我试图在地图上绘制带箭头的线来传达方向。

import folium

#DFW, LGA coordinates
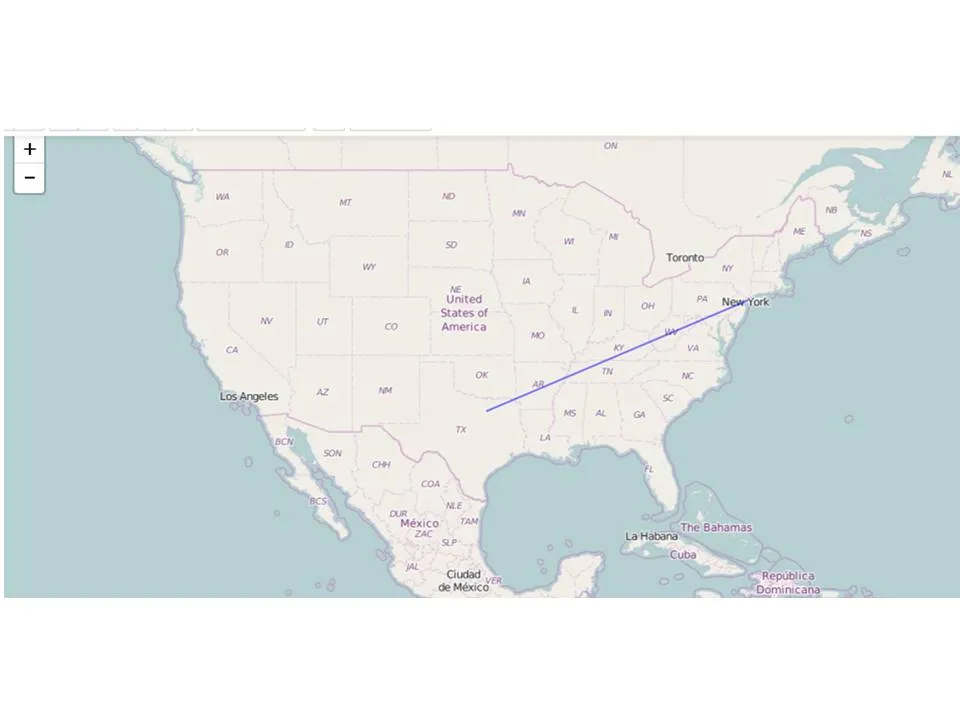
coordinates=[(32.900908, -97.040335),(40.768571, -73.861603)]

m = folium.Map(location=[32.900908, -97.040335], zoom_start=4)

#line going from dfw to lga
aline=folium.PolyLine(locations=coordinates,weight=2,color = 'blue')
m.add_children(aline)

enter image description here有没有办法在这条线上添加箭头?

3个回答

9
您可以使用正多边形标记器在终点处绘制一个三角形...
folium.RegularPolygonMarker(location=(32.900908, -97.040335), fill_color='blue', number_of_sides=3, radius=10, rotation=???).add_to(m)

您需要使用一些三角学来计算三角形旋转的角度,使其指向正确的方向。任何此类标记的初始点都指向正东。


3
绝对是个好主意!我用以下代码完成了这个操作:from math import atan # 返回弧度值 rotation = 90*atan(latitude_difference/longitude_difference) - Sergio Lucero
@SergioLucero,我觉得你的意思是 rotation = math.atan(latitude_difference / longitude_difference * math.cos(avg_latitude * math.pi/180)) * 180/math.pi。然后,为了使旋转在360度内正常工作,必须进行修正:rotation = rotation if longitude_difference>0 else rotation+180。然后,得到的旋转角度可以直接输入到 ´RegularPolygonMarker´。 - undefined

6

我可能有点晚到这个派对,但是我有另外一个建议可以帮助其他人解决这个问题。我建议使用 pyproj 包的 Geod 类,它可以进行大地测量和大圆计算。我们可以使用它来获取 LineString 的一段的前向和后向方位角。然后对于每个段,我们在其中一端添加一个小的多边形标记(或类似物)。

from pyproj import Geod
# loop your lines
for line in lines.itertuples():
    # format coordinates and draw line
    loc = [[j for j in reversed(i)] for i in line.geometry.coords]
    folium.PolyLine(loc, color="red").add_to(m)
    # get pieces of the line
    pairs = [(loc[idx], loc[idx-1]) for idx, val in enumerate(loc) if idx != 0]
    # get rotations from forward azimuth of the line pieces and add an offset of 90°
    geodesic = Geod(ellps='WGS84')
    rotations = [geodesic.inv(pair[0][1], pair[0][0], pair[1][1], pair[1][0])[0]+90 for pair in pairs]
    # create your arrow
    for pair, rot in zip(pairs, rotations):
        folium.RegularPolygonMarker(location=pair[0], color='red', fill=True, fill_color='red', fill_opacity=1,
                                    number_of_sides=3, rotation=rot).add_to(m)

我希望这段代码对某人有所帮助。祝你拥有美好的一天!=)


这对我有用,但是我没有把三角形放在线的末端,而是将它们放在中心位置,使用以下代码:centers = [((locations[idx][0] + locations[idx-1][0])/2, (locations[idx][1] + locations[idx-1][1])/2) for idx, val in enumerate(locations) if idx != 0],并将每一对的中心位置作为RegularPolygonMarker中的location参数。 - Carson Stevens

1
我找到了这个问题的解决方案:我使用三角函数计算自己的箭头点,然后使用这些点调用折线函数。
    def arrow_points_calculate(self, ini_lat, ini_long, heading):
    lenght_scale = 0.00012
    sides_scale = 0.000025
    sides_angle = 25

    latA= ini_lat
    longA = ini_long

    latB = lenght_scale * math.cos(math.radians(heading)) + latA
    longB = lenght_scale * math.sin(math.radians(heading)) + longA

    latC = sides_scale * math.cos(math.radians(heading + 180 - sides_angle)) + latB
    longC = sides_scale * math.sin(math.radians(heading + 180 - sides_angle)) + longB

    latD = sides_scale * math.cos(math.radians(heading + 180 + sides_angle)) + latB
    longD = sides_scale * math.sin(math.radians(heading + 180 + sides_angle)) + longB

    pointA = (latA, longA)
    pointB = (latB, longB)
    pointC = (latC, longC)
    pointD = (latD, longD)

    point = [pointA, pointB, pointC, pointD, pointB]
    return point


folium.PolyLine(locations=points, color="purple").add_to(
                        position_plot)

“Lenght_scale”和“Side_scale”变量必须根据您想要的箭头大小进行修改。如果您已经有箭头起点和终点的坐标,请使用最终坐标作为点B,并根据那些点之间的长度计算侧向比例尺(在我看来,点之间长度的20%是一个正确的比例尺)。
结果示例: 位置图+标题箭头 希望能对您有所帮助。

网页内容由stack overflow 提供, 点击上面的
可以查看英文原文,
原文链接