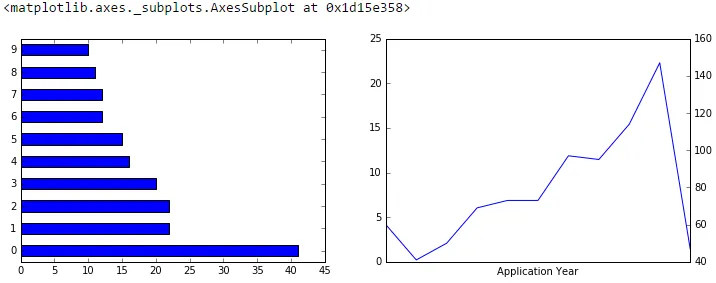
如何将两个folium地图并排显示?(类似下面的图片,但我想展示的是folium地图而不是matplotlib图表)
 编辑:我想在jupyter笔记本中展示这些地图。以下是我当前的代码,它会垂直(堆叠)展示两个地图。
编辑:我想在jupyter笔记本中展示这些地图。以下是我当前的代码,它会垂直(堆叠)展示两个地图。map_toronto = folium.Map(location=[43.6532, -79.3832], zoom_start=11)
# add markers to map
for lat, lng, borough in zip(toronto_df['Latitude'], toronto_df['Longitude'], toronto_df['District']):
label = '{}'.format(borough)
label = folium.Popup(label, parse_html=True)
folium.CircleMarker(
[lat, lng],
radius=5,
popup=label,
color='blue',
fill=True,
fill_color='#3186cc',
fill_opacity=0.7,
parse_html=False).add_to(map_toronto)
map_toronto
map_nyc = folium.Map(location=[40.7128, -74.0060], zoom_start=10)
# add markers to map
for lat, lng, borough in zip(nyc_df['Latitude'], nyc_df['Longitude'], nyc_df['District']):
label = '{}'.format(borough)
label = folium.Popup(label, parse_html=True)
folium.CircleMarker(
[lat, lng],
radius=5,
popup=label,
color='blue',
fill=True,
fill_color='#3186cc',
fill_opacity=0.7,
parse_html=False).add_to(map_nyc)
map_nyc