我使用matplotlib设计了一个子图。我正在尝试反转绘图的xticks。请参见以下示例代码-
import numpy as np
import matplotlib.pyplot as plt

# generate the data
n = 6
y = np.random.randint(low=0, high=10, size=n)
x = np.arange(n)

# generate the ticks and reverse it
xticks = range(n)
xticks.reverse()

# plot the data
plt.figure()
ax = plt.subplot(111)
ax.bar(x, y)
print xticks # prints [5, 4, 3, 2, 1, 0]
ax.set_xticks(xticks)
plt.show()
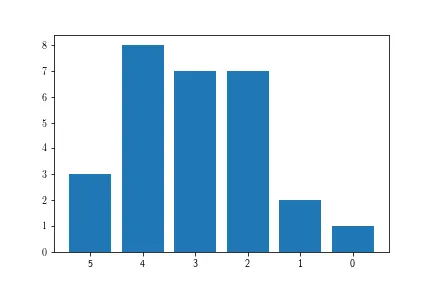
请查看下面生成的图表-
 请注意
请注意xticks。尽管使用了ax.set_xticks(xticks),但xticks没有改变。我是否漏掉了某个函数调用来重新渲染图表?以下是系统信息-
matplotlib.__version__
'2.1.1'

matplotlib.__version__numpy__
'1.7.1'

python --version
Python 2.7.15rc1
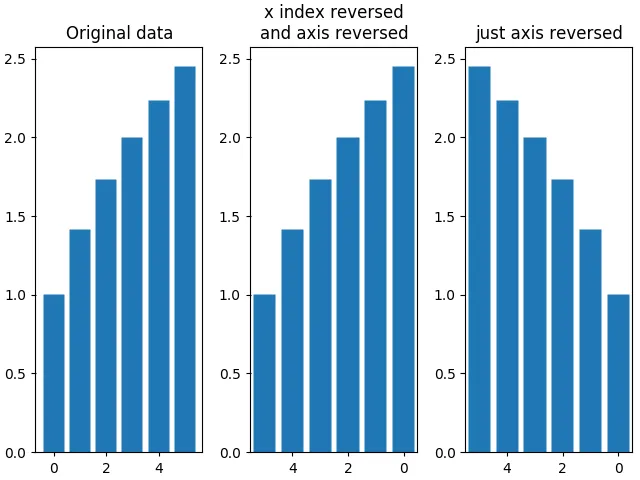
请注意,我只想反转刻度,而不想翻转坐标轴。