我一直在尝试使用离散的x变量(因为我想显示财政年度,即“2013/14”,而不是日历年)来生成堆积区域图表。 但是,将x轴变量转换为因子会导致无法呈现几何图形在最终图表中。是否有解决方法?
library(ggplot2)
dat <- structure(list(year = c(13, 13, 14, 14, 15, 15),
group_lvl = structure(c(1L, 2L, 1L, 2L, 1L, 2L),
.Label = c("a", "b"), class = "factor"),
val = c(35, 65, 50, 50, 75, 25)),
.Names = c("year", "group_lvl", "val"), row.names = c(NA, -6L),
class = "data.frame")
dat
year group_lvl val
1 13 a 35
2 13 b 65
3 14 a 50
4 14 b 50
5 15 a 75
6 15 b 25
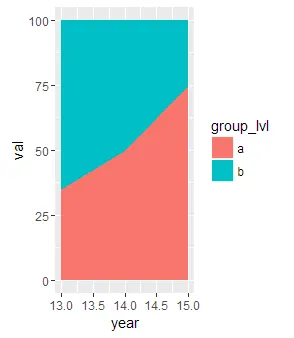
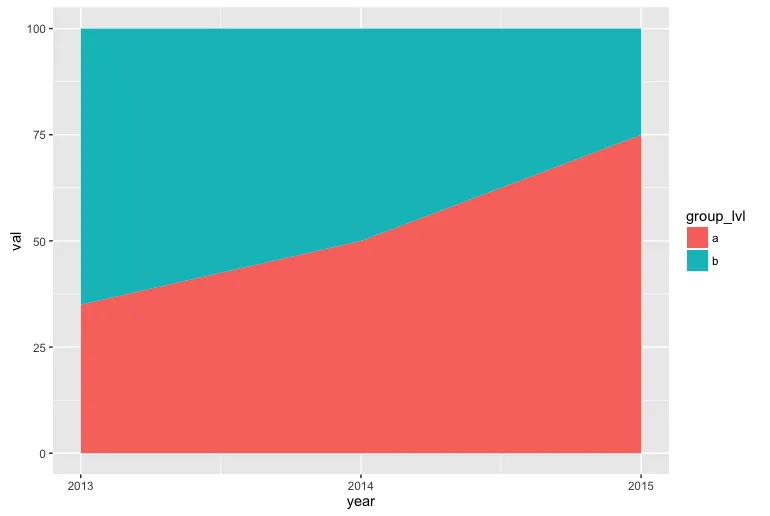
ggplot(dat, aes(x = year, y = val)) +
geom_area(aes(fill = group_lvl), position = "stack")
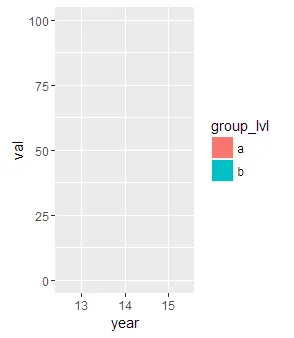
dat$year <- factor(dat$year)

ggplot(dat, aes(x = year, y = val)) +
  geom_area(aes(fill = group_lvl), position = "stack")
sessionInfo()
R version 3.3.0 (2016-05-03)
Platform: i386-w64-mingw32/i386 (32-bit)
Running under: Windows 7 x64 (build 7601) Service Pack 1

locale:
[1] LC_COLLATE=English_United Kingdom.1252  LC_CTYPE=English_United Kingdom.1252
[3] LC_MONETARY=English_United Kingdom.1252 LC_NUMERIC=C
[5] LC_TIME=English_United Kingdom.1252

attached base packages:
[1] stats     graphics  grDevices utils     datasets  methods   base

other attached packages:
[1] ggplot2_2.1.0

loaded via a namespace (and not attached):
 [1] labeling_0.3     colorspace_1.2-6 scales_0.4.0     plyr_1.8.3       tools_3.3.0
 [6] gtable_0.2.0     Rcpp_0.12.4      grid_3.3.0       digest_0.6.9     munsell_0.4.3
scale_x_continuous控制轴? - Gopala