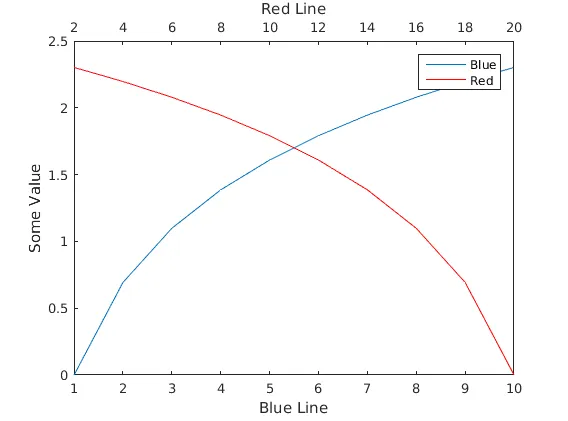
你可以在第一个轴的上方创建第二个轴,位置相同,将该轴的
XAxisLocation设置为
'top',没有
Color使其透明,没有yticks,并将其
YLim与第一个轴相连。此外,我们可以链接
Position值,以确保如果我们调整一个轴的大小,它们会一起调整大小以保持外观。
figure;
hax1 = axes();
xdata = 1:10;
hplot1 = line(xdata, log(xdata));
hax2 = axes('Position', get(hax1, 'Position'), ...
'XAxisLocation', 'top', ...
'YAxisLocation', 'right', ...
'xlim', [2 20], ...
'Color', 'none', ...
'YTick', []);
hplot2 = line(xdata * 2, log(flip(xdata)), 'Color', 'r', 'Parent', hax2);
linkprop([hax1, hax2], {'ylim', 'Position'});
xlabel(hax1, 'Blue Line')
xlabel(hax2, 'Red Line')
ylabel(hax1, 'Some Value')
legend([hplot1, hplot2], {'Blue', 'Red'})
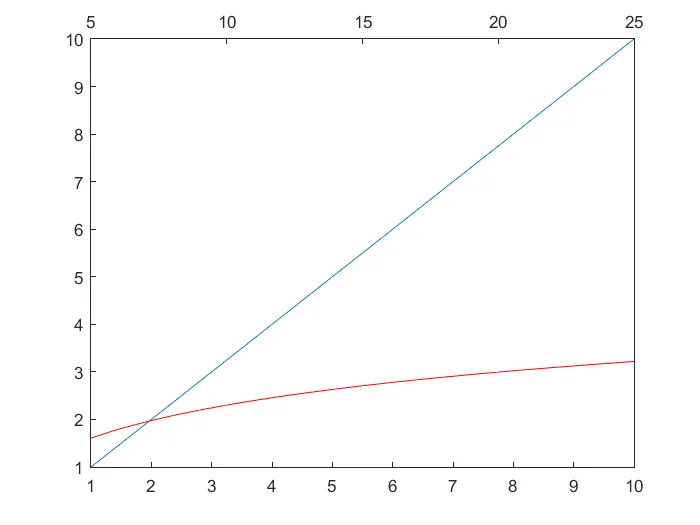
Carl W(原帖作者)的编辑
当刻度间距上下不同的时候,以上代码会导致丑陋的XTicks。我在matlab remove only top and right ticks with leaving box on上找到了一个解决方法。我稍微修改了上面的代码:
figure
xdata = 1:10;
plot(xdata)
hax1 = gca;
set(hax1,'box','off','color','white')
hax2 = axes('Position', get(hax1, 'Position'),'box','off', ...
'XAxisLocation', 'top', ...
'YAxisLocation', 'right', ...
'Color', 'none', ...
'YTick', []);
警告:这并不能与plot一起使用,因为它会覆盖现有的轴分配。
由于没有points函数(MathWorks太愚蠢了),我只能使用line(x,y,'linestyle','none','marker','x','parent',hax2)来获取点。
hplot2 = line(5:25, log((5:25)), 'Color', 'r', 'Parent', hax2);

linkprop([hax1,hax2],{'ylim','Position'});
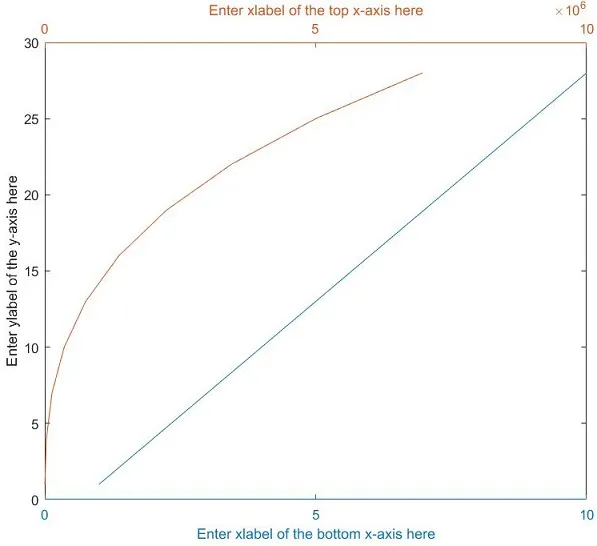
这会提供
。
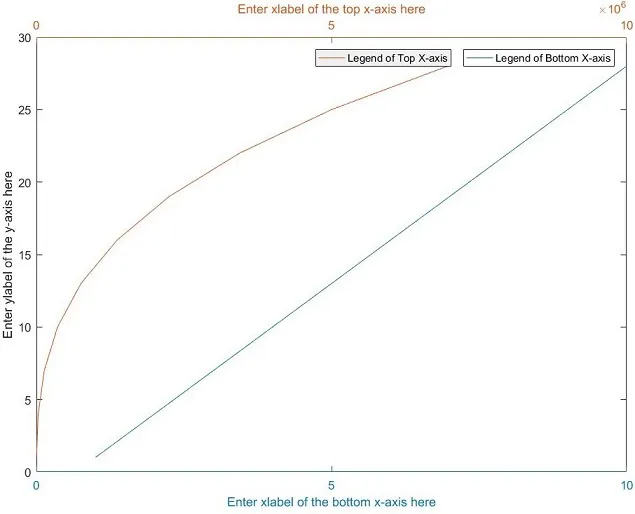
linkprop是我需要的魔法酱汁。 - Carl Witthoftplot,则可以在绘制对象创建后修改轴。 - Suever