我对scikit-learn和GMM一般都是新手...我在python(scikit-learn)中拟合高斯混合模型的质量有些问题。
我有一个数据数组,您可以在此处的数据中找到,我想用n = 2个组件的GMM进行拟合。
作为基准,我叠加了一个正常拟合。
错误/怪异:
- 将n = 1个组件设置为,我无法使用GMM(1)恢复正常的基准拟合
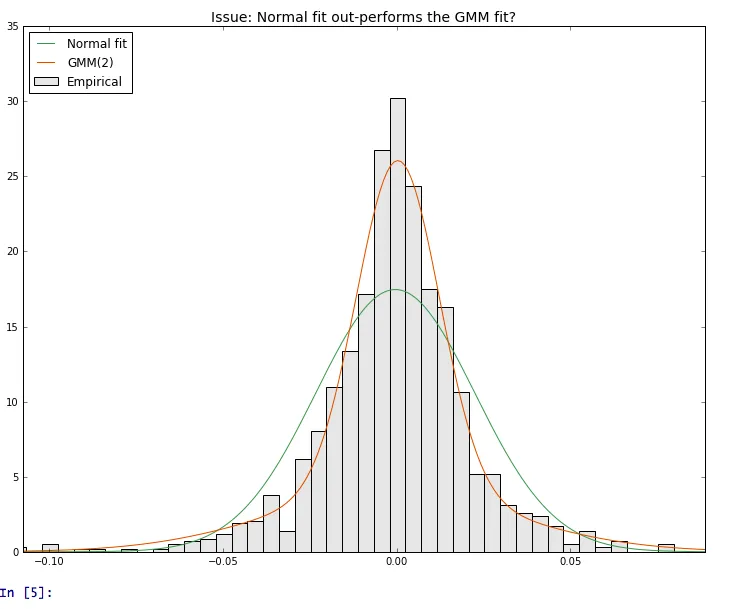
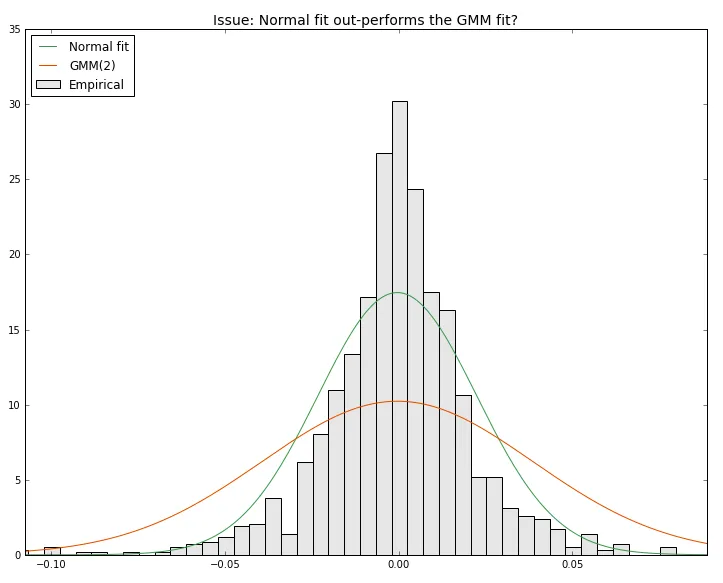
- 将n = 2个组件设置为,正常拟合优于GMM(2)拟合
- GMM(n)似乎总是提供相同的拟合...
这是我得到的:我在这里做错了什么?(图片显示了GMM(2)的拟合)。谢谢您的帮助。
from numpy import *
import pandas as pd
import matplotlib.pyplot as plt
from datetime import datetime
from collections import OrderedDict
from scipy.stats import norm
from sklearn.mixture import GMM

# Upload the data: "epsi" (array of floats)
file_xlsx = './db_X.xlsx'
data = pd.read_excel(file_xlsx)
epsi = data["epsi"].values;
t_   = len(epsi);

# Normal fit (for benchmark)
epsi_grid = arange(min(epsi),max(epsi)+0.001,0.001);

mu     = mean(epsi);
sigma2 = var(epsi);

normal = norm.pdf(epsi_grid, mu, sqrt(sigma2));

# TENTATIVE - Gaussian mixture fit
gmm = GMM(n_components = 2); # fit quality doesn't improve if I set: covariance_type = 'full'
gmm.fit(reshape(epsi,(t_,1)));

gauss_mixt = exp(gmm.score(reshape(epsi_grid,(len(epsi_grid),1))));

# same result if I apply the definition of pdf of a Gaussian mixture:
# pdf_mixture = w_1 * N(mu_1, sigma_1) + w_2 * N(mu_2, sigma_2)
# as suggested in:
# http://stackoverflow.com/questions/24878729/how-to-construct-and-plot-uni-variate-gaussian-mixture-using-its-parameters-in-p
#
#gauss_mixt = array([p * norm.pdf(epsi_grid, mu, sd) for mu, sd, p in zip(gmm.means_.flatten(), sqrt(gmm.covars_.flatten()), gmm.weights_)]);
#gauss_mixt = sum(gauss_mixt, axis = 0);


# Create a figure showing the comparison between the estimated distributions

# setting the figure object
fig = plt.figure(figsize = (10,8))
fig.set_facecolor('white')
ax = plt.subplot(111)

# colors
red   = [0.9, 0.3, 0.0];
grey  = [0.9, 0.9, 0.9];
green = [0.2, 0.6, 0.3];

# x-axis limits
q_inf = float(pd.DataFrame(epsi).quantile(0.0025));
q_sup = float(pd.DataFrame(epsi).quantile(0.9975));
ax.set_xlim([q_inf, q_sup])

# empirical pdf of data
nb     = int(10*log(t_));
ax.hist(epsi, bins = nb, normed = True, color = grey, edgecolor = 'k', label = "Empirical");

# Normal fit
ax.plot(epsi_grid, normal, color = green, lw = 1.0, label = "Normal fit");

# Gaussian Mixture fit
ax.plot(epsi_grid, gauss_mixt, color = red, lw = 1.0, label = "GMM(2)");

# title
ax.set_title("Issue: Normal fit out-performs the GMM fit?", size = 14)

# legend
ax.legend(loc='upper left');

plt.tight_layout()
plt.show()