gnuplot:一个数据矩阵的三维图绘制

8
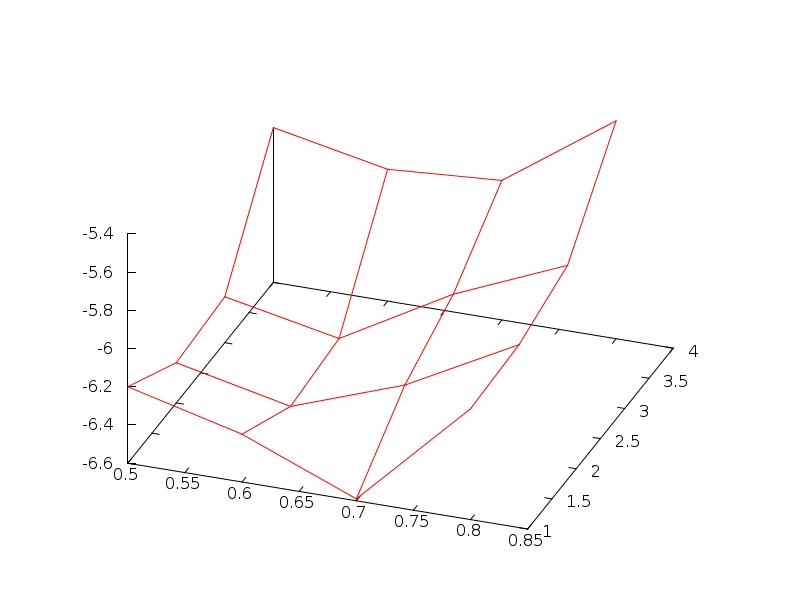
我该如何在Gnuplot中绘制一个矩阵(3D图形),并且使用第一行和第一列作为x和y轴刻度(第一行的第一个数字是列数)?
4 0.5 0.6 0.7 0.8
1 -6.20 -6.35 -6.59 -6.02
2 -6.39 -6.52 -6.31 -6.00
3 -6.36 -6.48 -6.15 -5.90
4 -5.79 -5.91 -5.87 -5.46
2个回答

7

这种数据格式可以使用 matrix nonuniform 读取:

set view 50,20
set ticslevel 0
splot 'data.txt' matrix nonuniform with lines t ''

这将生成正确的刻度,就像数据文件中指定的那样:

enter image description here


1
要绘制一个四维图,使用颜色作为第四个维度,您可以使用:
splot  '1.txt' using 2:3:4:5  every ::1  palette
#  |                              |
#  |                              |
# used for 3d plots            skip the header line

或者您想画出不同的图像,其中x和y是第一列和行,矩阵中的数字只表示z?那么请使用以下内容:

splot '1.txt' every ::1:1 matrix

为了增加一些效果,您可以将其更改为

set dgrid3d 4,4
splot '1.txt' every ::1:1 matrix with lines

非常感谢!最后一个解决方案 "set dgrid3d 4,4; splot '1.txt' every ::1:1 matrix with lines" 对我很有帮助。只是我想在图表底部使用 x 刻度 "0.5 0.6 0.7 0.8" 和 y 刻度 "1 2 3 4"。这可能吗? - micheletuttafesta
@micheletuttafesta:你可以使用set xtics (0.5, 0.6, 0.7, 0.8)。据我所知,gnuplot没有从输入文件中获取数字的方法,因此您必须生成gnuplot脚本:head -n1 input.txt | sed 's/ /,/g;s/^/set xtics(/;s/$/)/' > script.gp - choroba
谢谢 choroba!你的建议是我的最终解决方案。 - micheletuttafesta
实际上,gnuplot 有一个命令可以精确地读取这种数据格式,并且也使用了正确的刻度线,详见我的答案。 - Christoph

网页内容由stack overflow 提供, 点击上面的
可以查看英文原文,
原文链接