如何在Gnuplot中绘制(2D绘图)一个具有以下数据结构的矩阵,使用第一行和第一列作为x和y刻度(第一行的第一个数字是列数),并通过颜色映射来表示其余值,以便在2D平面上可见?
4 0.5 0.6 0.7 0.8
1 -6.20 -6.35 -6.59 -6.02
2 -6.39 -6.52 -6.31 -6.00
3 -6.36 -6.48 -6.15 -5.90
4 -5.79 -5.91 -5.87 -5.46
如何在Gnuplot中绘制(2D绘图)一个具有以下数据结构的矩阵,使用第一行和第一列作为x和y刻度(第一行的第一个数字是列数),并通过颜色映射来表示其余值,以便在2D平面上可见?
4 0.5 0.6 0.7 0.8
1 -6.20 -6.35 -6.59 -6.02
2 -6.39 -6.52 -6.31 -6.00
3 -6.36 -6.48 -6.15 -5.90
4 -5.79 -5.91 -5.87 -5.46
您可以使用 matrix nonuniform 格式绘制这些数据。
要获取热力图,您可以使用 with image(正则网格,无插值,每个数据点一个四边形),或者使用 with pm3d 的 splot(还支持不规则网格和插值,将为四个相邻的数据点绘制一个四边形)。
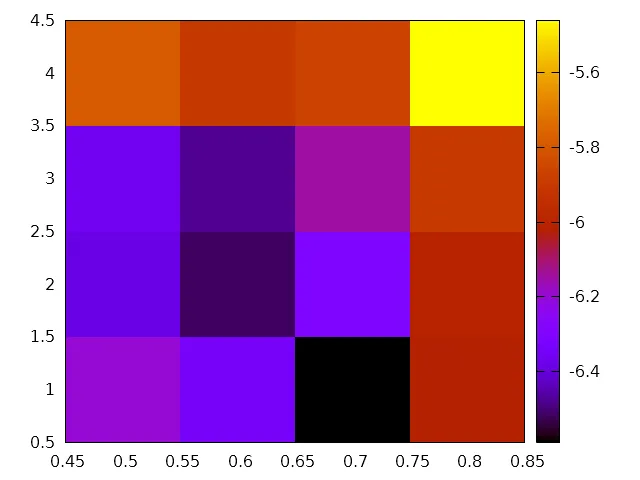
with image
set autoscale xfix
set autoscale yfix
set autoscale cbfix
plot 'data.dat' matrix nonuniform with image notitle
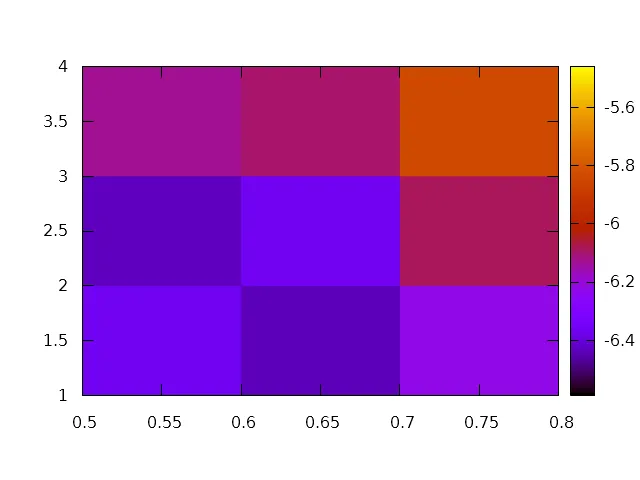
pm3d
set autoscale xfix
set autoscale yfix
set autoscale cbfix
set pm3d map
splot 'data.dat' matrix nonuniform notitle
(x,y)网格位置上? - Gathidelabels绘图样式,参见例如 https://dev59.com/MoXca4cB1Zd3GeqPHV4E#27049991 - Christoph