我将制作动画。在每一帧中,我希望包含一个使用Mayavi获得的绘图。
mlab.pipeline.iso_surface(source, some other superfluous args)
并且可以使用简单的方法获得一个使用matplotlib绘制的图表
pylab.plot(args)
我有单独实现这两个脚本的代码,但不知道如何将它们合并成一个图形。我希望最终的产品是一个包含当前已有两个脚本代码的脚本。
我将制作动画。在每一帧中,我希望包含一个使用Mayavi获得的绘图。
mlab.pipeline.iso_surface(source, some other superfluous args)
并且可以使用简单的方法获得一个使用matplotlib绘制的图表
pylab.plot(args)
我有单独实现这两个脚本的代码,但不知道如何将它们合并成一个图形。我希望最终的产品是一个包含当前已有两个脚本代码的脚本。
matplotlib轴添加到mayavi.figure中,反之亦然。mlab.screenshot来实现“一种方法”。import mayavi.mlab as mlab
import matplotlib.pyplot as plt
# create and capture a mlab object
mlab.test_plot3d()
img = mlab.screenshot()
mlab.close()
# create a pyplot
fig = plt.figure()
ax1 = fig.add_subplot(121)
ax1.plot([0,1], [1,0], 'r')
# add the screen capture
ax2 = fig.add_subplot(122)
ax2.imshow(img)
ax2.set_axis_off()
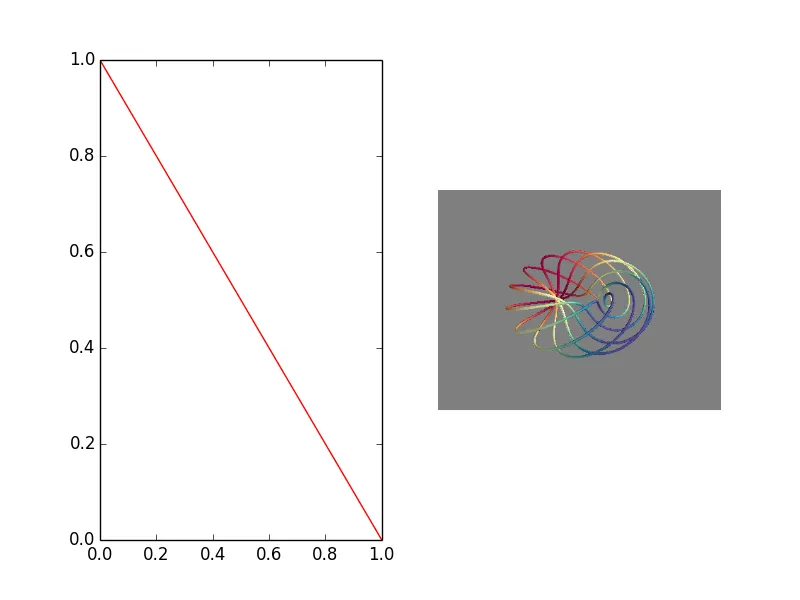
这并不一定是最好的方法,你可能会遇到分辨率问题(检查mayavi窗口的大小)。但是,在大多数情况下,它可以完成工作。
在DrV的回答基础上,我得到了很大帮助。您可以使用mlab图形来设置分辨率,例如批量绘制屏幕截图:
mfig = mlab.figure(size=(1024, 1024))
src = mlab.pipeline.scalar_field(field_3d_numpy_array)
mlab.pipeline.iso_surface(src)
iso_surface_plot = mlab.screenshot(figure=mfig, mode='rgba', antialiased=True)
mlab.clf(mfig)
mlab.close()

# Then later in a matplotlib fig:
plt.imshow(iso_surface_plot)