我正在尝试使用sjPlot中的plot_model()函数创建一个预测值的图表。我希望我的预测线有不同的线型和不同的颜色。
该函数包括一个colors参数,将colors设置为bw将更改linetype,但会将colors设置为灰度。这个问题类似,但没有得到有用的答案:Colored ribbons and different linetypes in sjPlot plot_model()
示例:
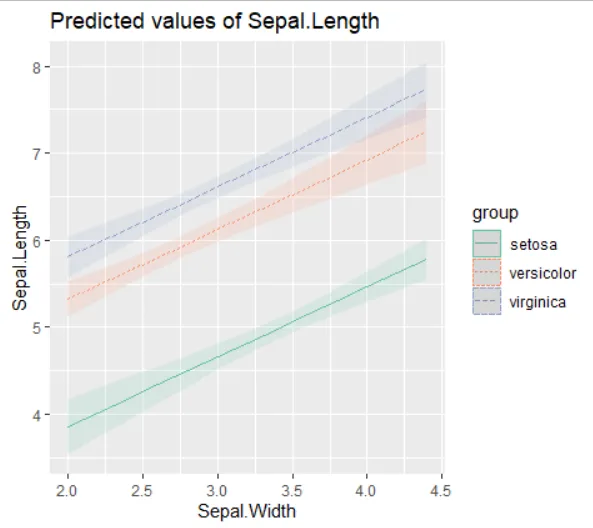
不同的linetypes,但不是colors
data(iris)
toy_model <- lm( Sepal.Length ~ Sepal.Width + Species, data=iris)

my_plot <- plot_model(toy_model, type=("pred"),
terms=c("Sepal.Width","Species"),
colors="bw")
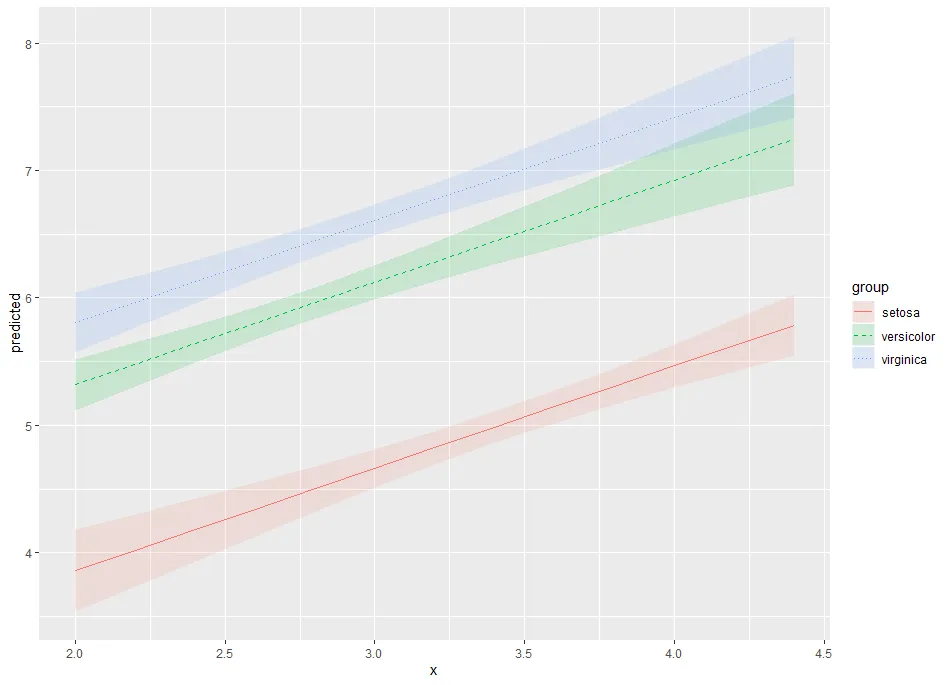
不同的颜色,但不包括线型
data(iris)
toy_model <- lm( Sepal.Length ~ Sepal.Width + Species, data=iris)

my_plot <- plot_model(toy_model, type=("pred"),
terms=c("Sepal.Width","Species"))
我该如何同时获得不同的颜色和不同的线型?换句话说,我想要像这样的效果:
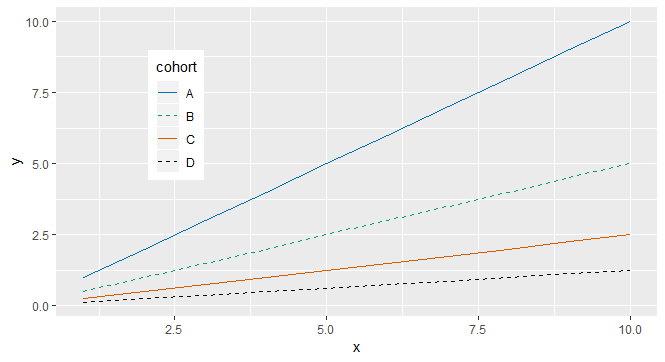 。
。