我正在创建一个带有3个子图的图形,想知道是否有一种方法可以移除它们周围的框架,同时保留坐标轴的位置?
4个回答
39
如果您想要移除轴脊柱,但不删除其他信息(刻度线、标签等),可以按照以下方式操作:
或者更容易的是,使用seaborn:
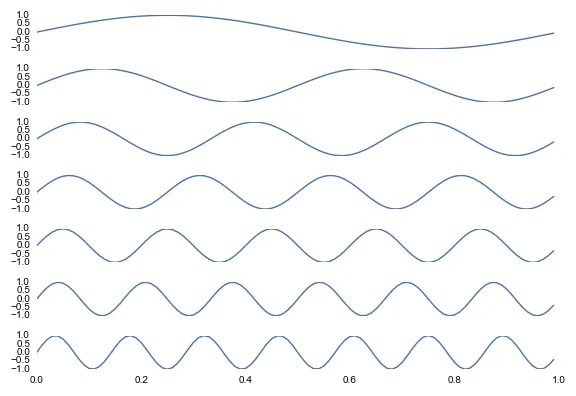
fig, ax = plt.subplots(7,1, sharex=True)

t = np.arange(0, 1, 0.01)

for i, a in enumerate(ax):
    a.plot(t, np.sin((i + 1) * 2 * np.pi * t))
    a.spines["top"].set_visible(False)
    a.spines["right"].set_visible(False)
    a.spines["bottom"].set_visible(False)
或者更容易的是,使用seaborn:
fig, ax = plt.subplots(7,1, sharex=True)

t = np.arange(0, 1, 0.01)

for i, a in enumerate(ax):
    a.plot(t, np.sin((i + 1) * 2 * np.pi * t))

seaborn.despine(left=True, bottom=True, right=True)
两种方法都会给你:
- mwaskom
3
39
试试plt.box(on=None)。它只删除绘图周围的边框(外框),这正是我想做的。
plt.axis('off') 删除了刻度标签和边框,但这不是我要实现的目标。
- Ben Miller
6
您可以使用轴句柄的
axis('off')方法来实现类似于此的效果。这是您想要的吗?(下图中的示例代码)。fig, ax = plt.subplots(7,1)
t = np.arange(0, 1, 0.01)
for i, a in enumerate(ax):
a.plot(t, np.sin((i+1)*2*np.pi*t))
a.axis('off')
plt.show()
- Bonlenfum
3
尝试
ax.set_frame_on(False)
它可以移除任何绘图周围的框架,但X轴和Y轴的刻度仍然存在。
- MattSt
网页内容由stack overflow 提供, 点击上面的可以查看英文原文,
原文链接
原文链接
for a in ax:- Douglas Adams