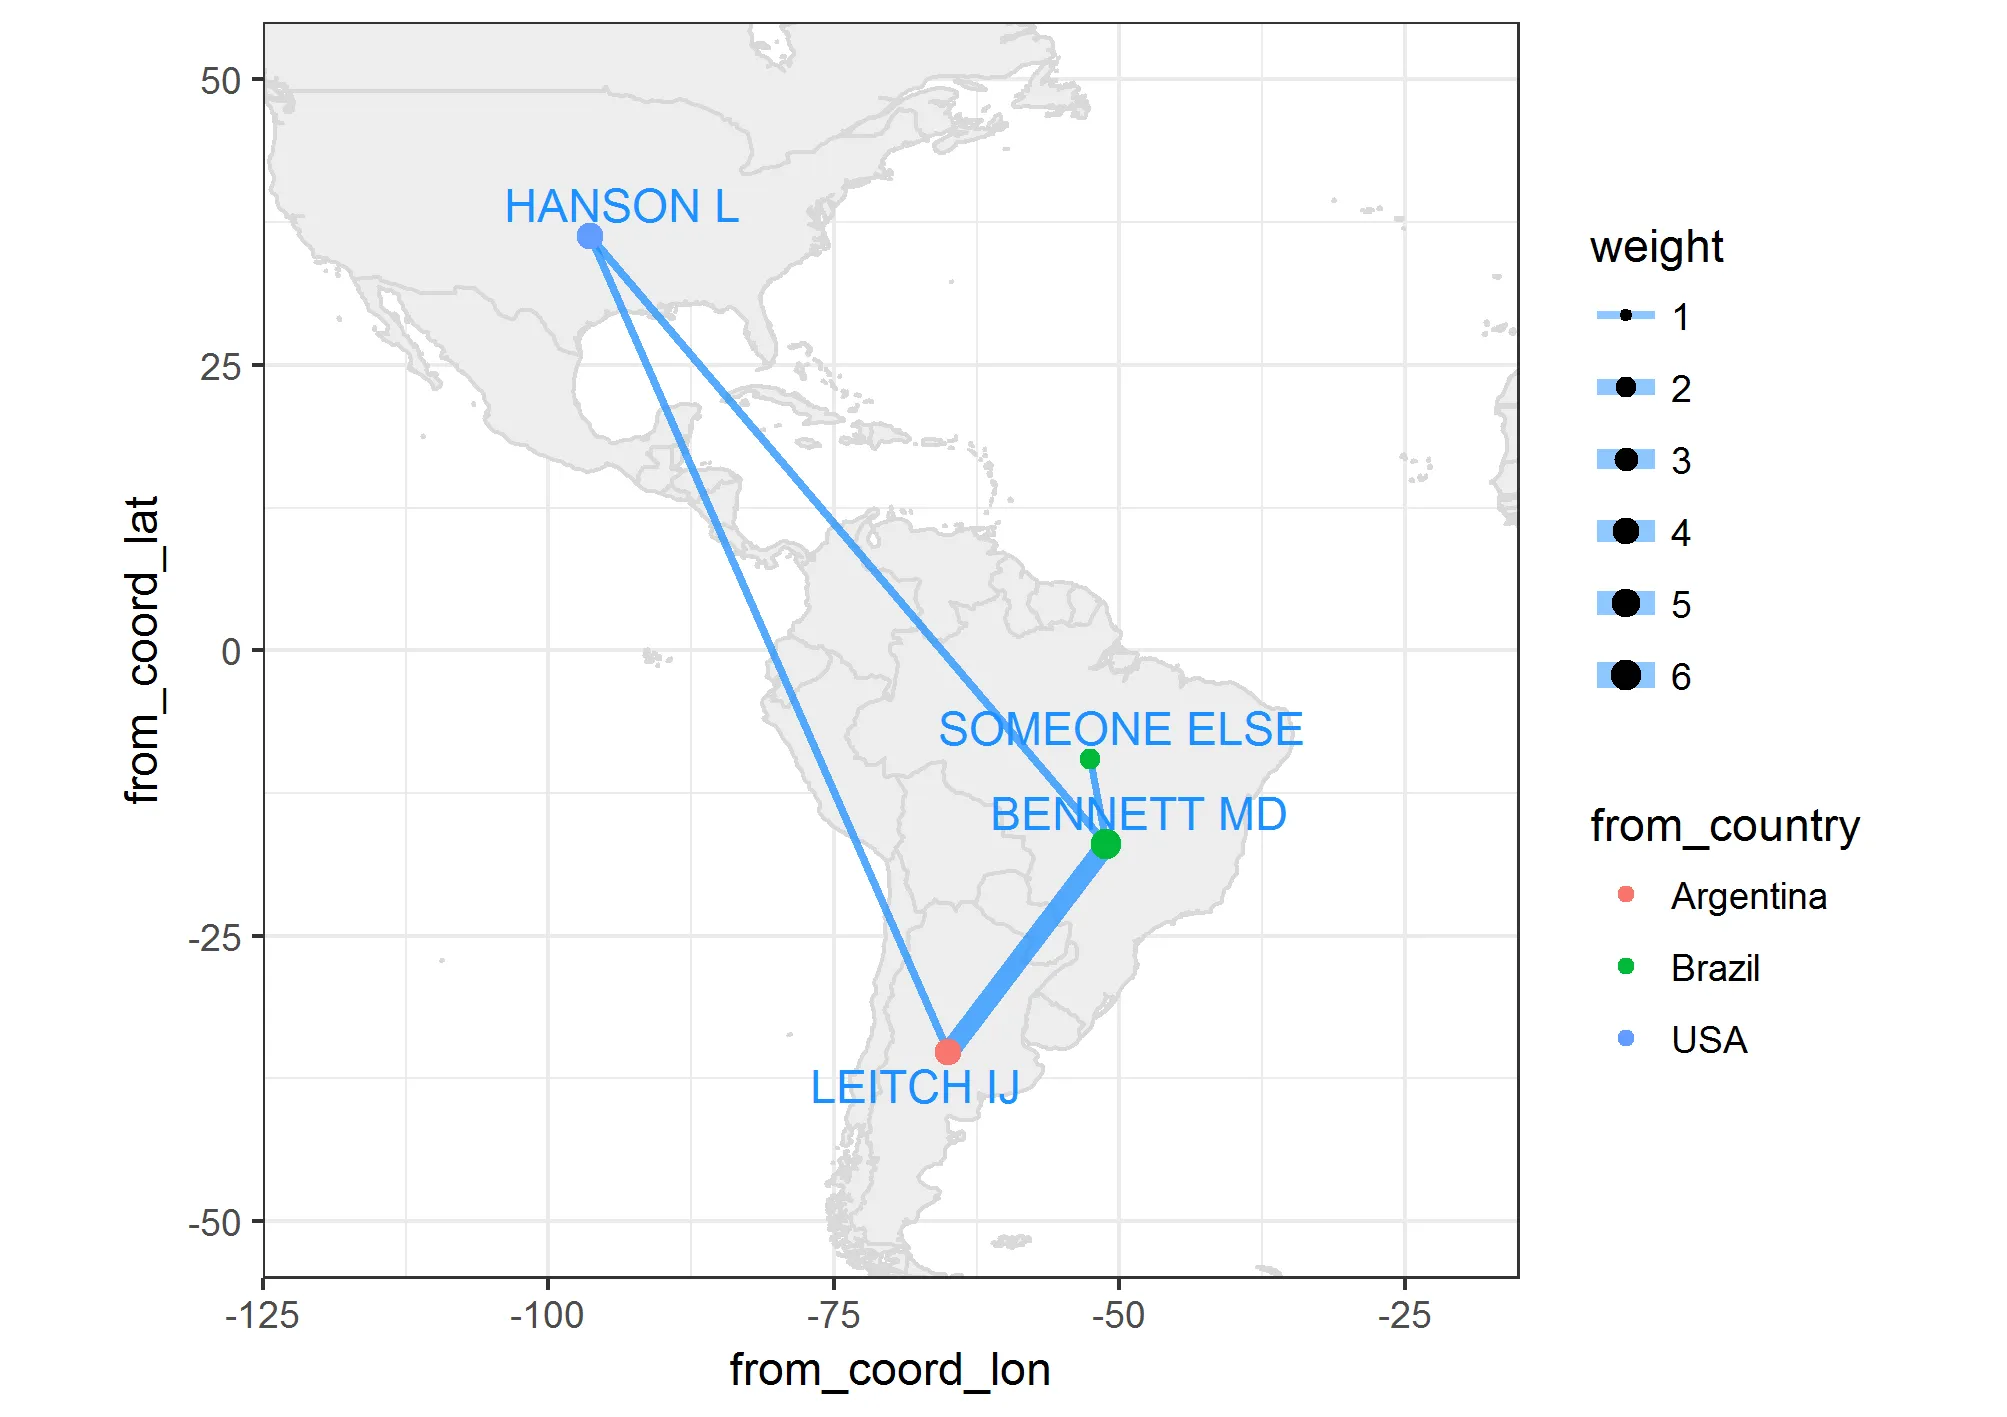
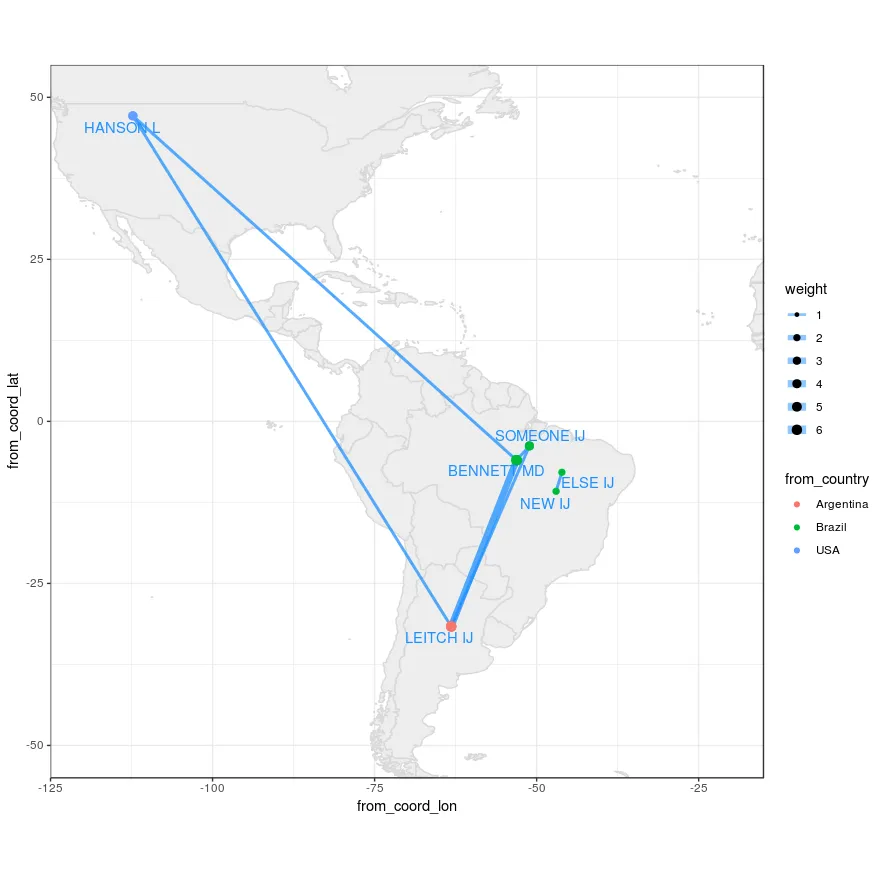
我有一些作者及其所属城市或国家,想知道是否可以在地图上绘制共同作者的网络(图1),并拥有各国的坐标。请考虑来自同一国家的多位作者。[编辑:应生成几个网络(如示例中),并且不应显示可避免的重叠]。这适用于数十位作者。缩放选项是可取的。将来如果有更好的回答会有100美元的奖励承诺。
refs5 <- read.table(text="
                    row          bibtype year volume   number    pages      title          journal                          author
                    Bennett_1995 article 1995     76    <NA> 113--176 angiosperms.  \"Annals of Botany\"           \"Bennett Md, Leitch Ij\"
                    Bennett_1997 article 1997     80       2 169--196 estimates.  \"Annals of Botany\"           \"Bennett MD, Leitch IJ\"
                    Bennett_1998 article 1998     82 SUPPL.A 121--134 weeds.  \"Annals of Botany\" \"Bennett MD, Leitch IJ, Hanson L\"
                    Bennett_2000 article 2000     82 SUPPL.A 121--134 weeds.  \"Annals of Botany\" \"Bennett MD, Someone IJ\"
                    Leitch_2001 article 2001     83 SUPPL.A 121--134 weeds.  \"Annals of Botany\" \"Leitch IJ, Someone IJ\"
                    New_2002 article 2002     84 SUPPL.A 121--134 weeds.  \"Annals of Botany\" \"New IJ, Else IJ\"" , header=TRUE,stringsAsFactors=FALSE)

rownames(refs5) <- refs5[,1]
refs5<-refs5[,2:9]
citations <- as.BibEntry(refs5)

authorsl <- lapply(citations, function(x) as.character(toupper(x$author)))
unique.authorsl<-unique(unlist(authorsl))
coauth.table <- matrix(nrow=length(unique.authorsl),
                       ncol = length(unique.authorsl),
                       dimnames = list(unique.authorsl, unique.authorsl), 0)
for(i in 1:length(citations)){
  paper.auth <- unlist(authorsl[[i]])
  coauth.table[paper.auth,paper.auth] <- coauth.table[paper.auth,paper.auth] + 1
}
coauth.table <- coauth.table[rowSums(coauth.table)>0, colSums(coauth.table)>0]
diag(coauth.table) <- 0
coauthors<-coauth.table

bip = network(coauthors,
              matrix.type = "adjacency",
              ignore.eval = FALSE,
              names.eval = "weights")

authorcountry <- read.table(text="
 author country
1    \"LEITCH IJ\"     Argentina
2    \"HANSON L\"          USA
3    \"BENNETT MD\"       Brazil
4    \"SOMEONE IJ\"       Brazil
5    \"NEW IJ\"           Brazil
6    \"ELSE IJ\"          Brazil",header=TRUE,fill=TRUE,stringsAsFactors=FALSE)


matched<-   authorcountry$country[match(unique.authorsl, authorcountry$author)]

bip %v% "Country" = matched
colorsmanual<-c("red","darkgray","gainsboro")
names(colorsmanual) <- unique(matched)

gdata<- ggnet2(bip, color = "Country", palette = colorsmanual, legend.position = "right",label = TRUE,
               alpha = 0.9, label.size = 3, edge.size="weights",
               size="degree", size.legend="Degree Centrality") + theme(legend.box = "horizontal")
gdata
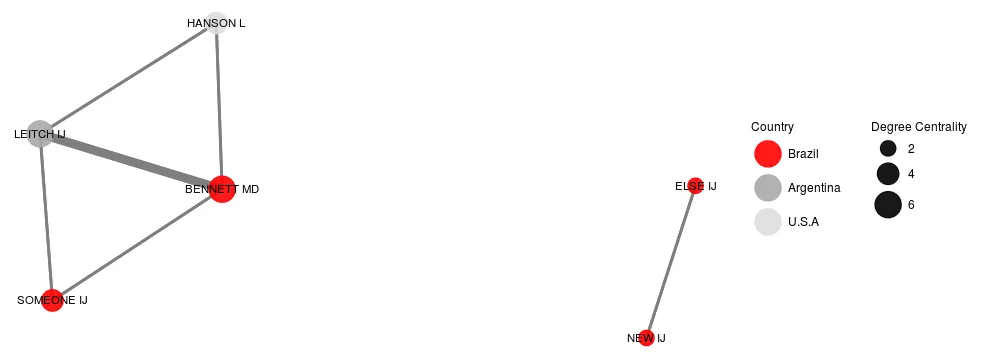 图1 网络
图1 网络编辑:当前JanLauGe答案重叠了两个不相关的网络。作者“ELSE”和“NEW”需要像图1中一样与其他人分开。
as.BibEntry函数属于哪个包? - and-bri