当我尝试使用
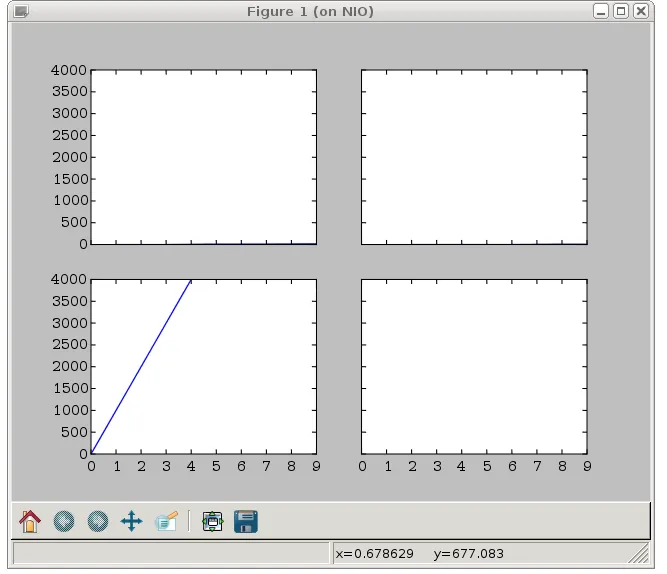
pyplot.subplots绘制多个子图时,会得到如下结果:
我该如何做到以下三点呢?
- 每个子图都有独立的轴
- 每个子图都有自己的坐标轴
- 在每个子图的轴上叠加绘图 使用subplots。我尝试了
((ax1,ax2),(ax3,ax4)) = subplots然后两次调用ax1.plot,但结果没有任何显示。
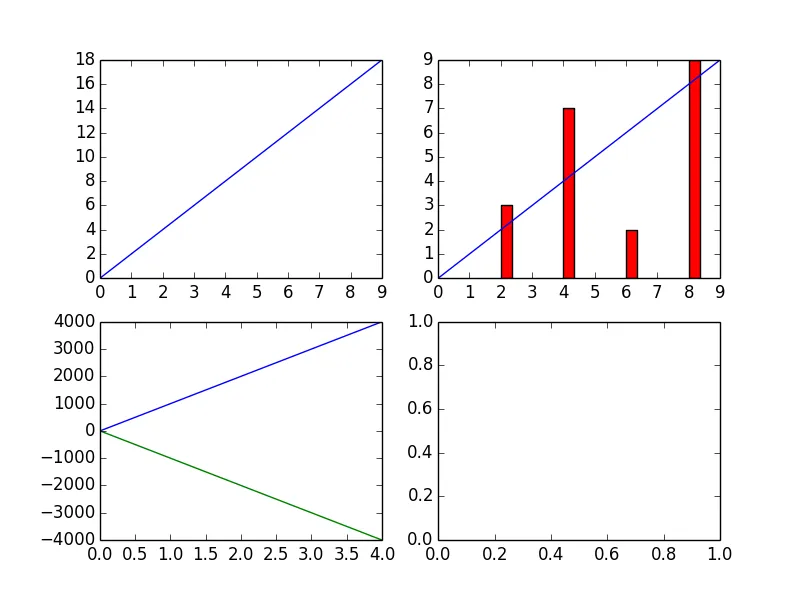
图片对应的代码:
import string
import matplotlib
matplotlib.use('WX')

import matplotlib.pyplot as plt
import matplotlib.mlab as mlab
import numpy as np
from itertools import izip,chain


f,((ax1,ax2),(ax3,ax4)) = plt.subplots(2,2,sharex='col',sharey='row')

ax1.plot(range(10),2*np.arange(10))
ax2.plot(range(10),range(10))
ax3.plot(range(5),np.arange(5)*1000)
#pyplot.yscale('log')
#ax2.set_autoscaley_on(False)
#ax2.set_ylim([0,10])


plt.show()