我无法自动布局显示JGraphX。
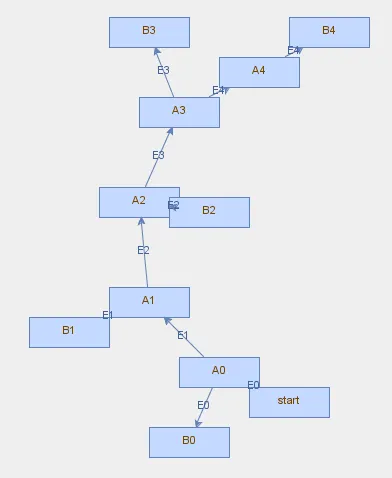
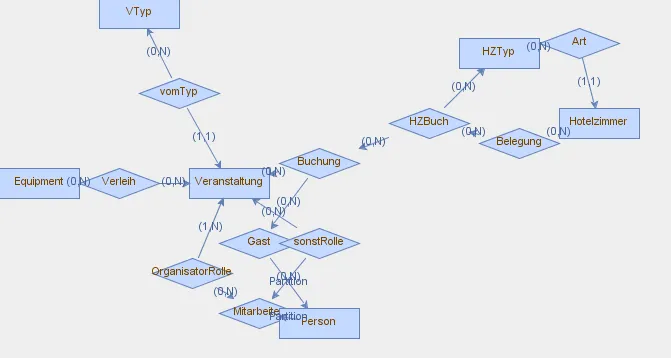
我的程序(代码如下)创建了以下输出:
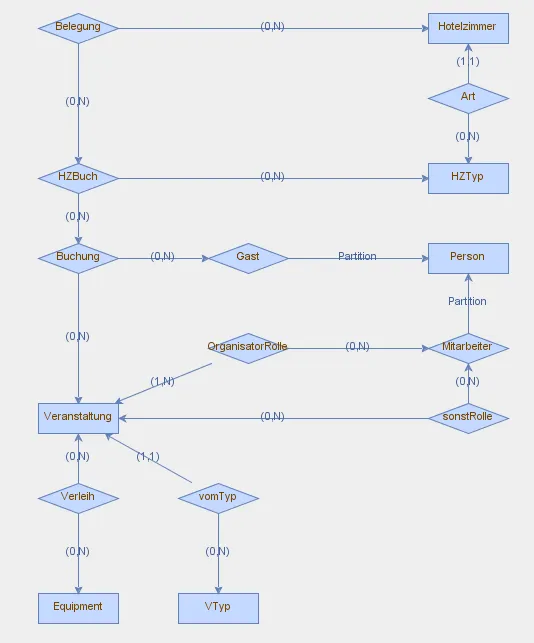
一个足够好的结果应该像这样(我手动移动它们):
我不一定要使用JGraphX。我还测试过JUNG和JGraphT。但这是我迄今为止得到的最佳结果。我需要一个视图来显示我的数据,有直接的边缘和一些标签。
我制作了一个示例代码,展示了它是如何创建的。它类似于http://forum.jgraph.com/questions/4810/how-to-layout-nodes-automatically-using-fast-organic-layout。 有一个2012年的评论提到了同样的问题:“[...] 然而,我已经注意到节点有时会重叠,你知道修复这个问题的方法吗?我已经尝试调整属性,但它似乎很随机。有什么建议可以改进整体外观吗?"
public class Test extends JFrame {

        public static void main(String[] args) {
                JFrame f = new JFrame();
                f.setSize(800, 800);
                f.setLocation(300, 200);
                f.setDefaultCloseOperation(JFrame.EXIT_ON_CLOSE);

                final mxGraph graph = new mxGraph();

                mxGraphComponent graphComponent = new mxGraphComponent(graph);
                f.getContentPane().add(graphComponent, BorderLayout.CENTER);

                f.setVisible(true);
                Object parent = graph.getDefaultParent();

                graph.getModel().beginUpdate();
                try {
                        Object start = graph.insertVertex(parent, "start", "start", 100,
                                        100, 80, 30);
                        for (int i = 0; i < 10; i++) {
                                Object a = graph.insertVertex(parent, "A" + i, "A" + i, 100,
                                                100, 80, 30);
                                graph.insertEdge(parent, null, "E" + i, start, a);

                                Object b = graph.insertVertex(parent, "B" + i, "B" + i, 100,
                                                100, 80, 30);
                                graph.insertEdge(parent, null, "E" + i, a, b);
                                start = a;
                        }
                } finally {
                        graph.getModel().endUpdate();
                }

                morphGraph(graph, graphComponent);
        }

        private static void morphGraph(mxGraph graph,
                        mxGraphComponent graphComponent) {
                // define layout
                mxIGraphLayout layout = new mxFastOrganicLayout(graph);

                // layout using morphing
                graph.getModel().beginUpdate();
                try {
                        layout.execute(graph.getDefaultParent());
                } finally {
                        mxMorphing morph = new mxMorphing(graphComponent, 20, 1.5, 20);

                        morph.addListener(mxEvent.DONE, new mxIEventListener() {

                                @Override
                                public void invoke(Object arg0, mxEventObject arg1) {
                                        graph.getModel().endUpdate();
                                        // fitViewport();
                                }

                        });

                        morph.startAnimation();
                }

        }
}
示例生成的图表: